Posted 26 October 2020, 2:55 pm EST
Hi,
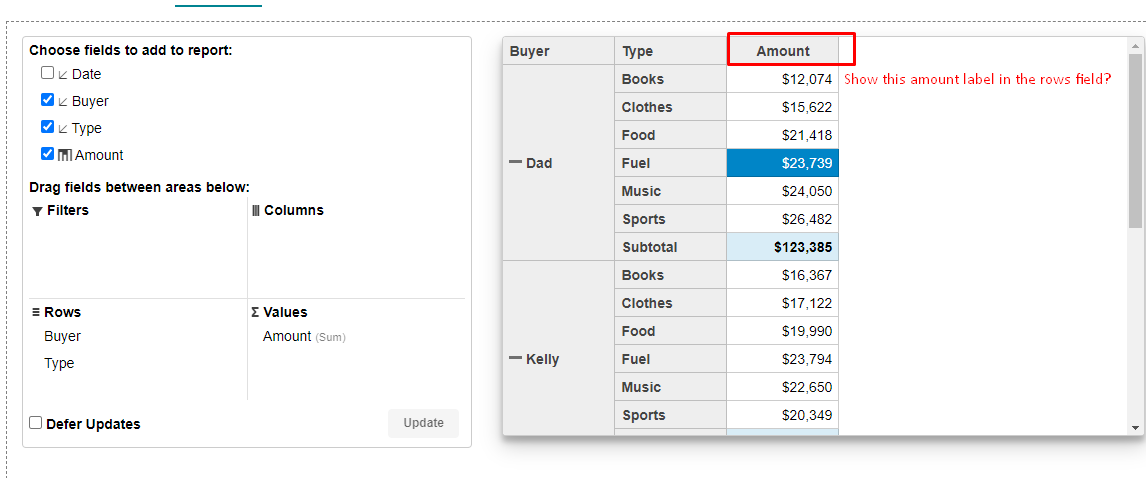
I’m looking to show measure values in the values area in Pivot grid, but have their descriptions show along the vertical axis, rather than the default of columns, that it seems to be using.
I can see that you can move individual measures onto the rows section, but the goal is to show a single ‘values’ or ‘measures’ group in the rows, and keep the measure selection in the values area so we can see the measure descriptions along the side rather than on top of the grid.
This is fairly simple pivot grid functionality, so I would be surprised if this isn’t there.
I can’t find a demo that does this - is it possible?
Thanks,
Nemanja