Posted 21 January 2019, 3:13 pm EST
Hello,
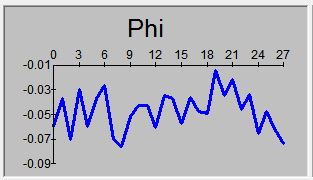
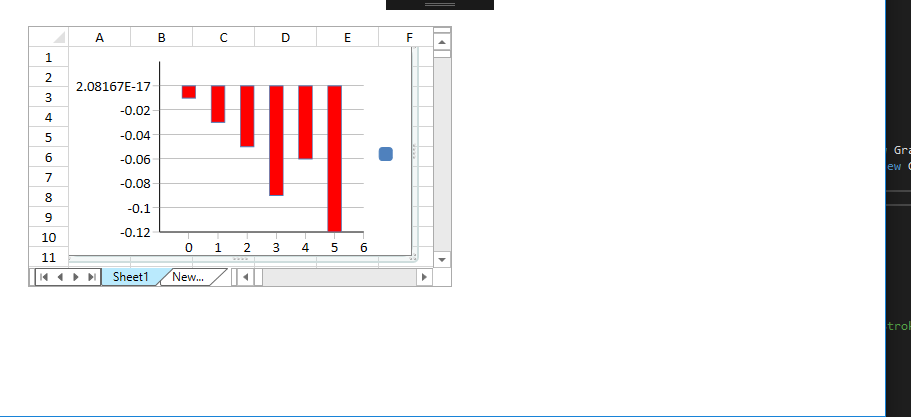
I’m trying to create a simple line chart that only shows the data points, a chart title, and the X/Y axis with ticks. I have been able to plot the data points and the chart title but I have not been able to prevent the application from showing the “Series 1” label and associated graphic and this makes my chart smaller and it is not necessary since I have only one data set. I have tried using some of the examples from the Help application but the “Series 1” label is still there. I’m also trying to get the chart to automatically detect that the values are negative and display the X-Axis on the top. And to show only specific ticks for example I have 27 data points and I want the X axis to show a tick every 3 data point.
|-----|----|----|
0 3 6 9
Thanks,
Luis