Posted 24 March 2021, 5:13 am EST - Updated 30 September 2022, 3:26 pm EST
There is a data source which is with the following columns:
- DateTime
- SalesPerson
- Amount
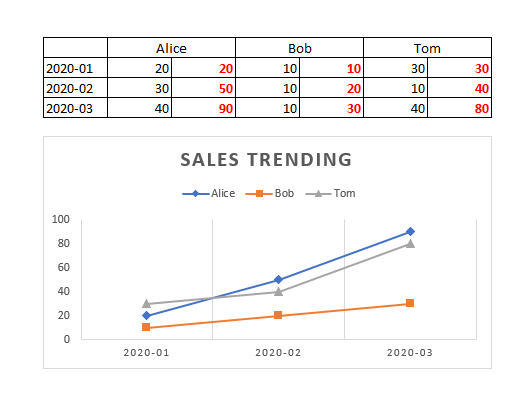
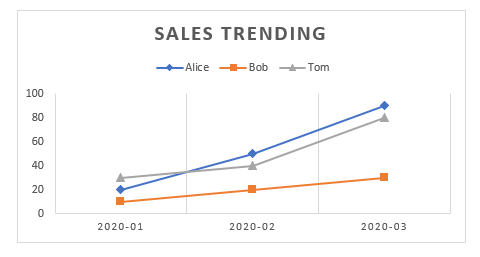
I can aggregate the amount in PivotTable by “RUNNINGVALUE(“field”,SUM,“scope”)” function. And I want to know how to do it with chart like the picture below.