Posted 29 January 2026, 5:04 am EST - Updated 29 January 2026, 5:09 am EST
Hello,
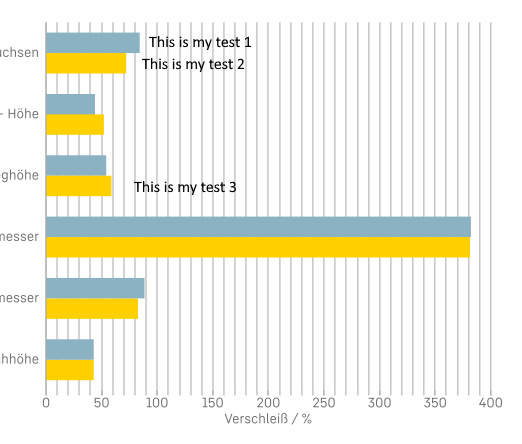
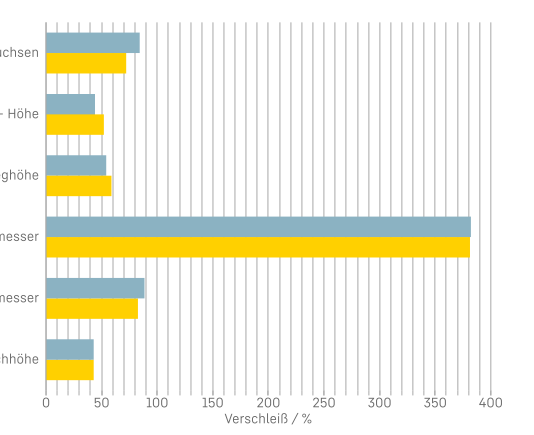
I am creating a bar chart in ActiveReports (Section Report) with two series (sometimes more). The axes are inverted so the bars are horizontal (see image 1).
Now I would like every bar to show a custom text label next to it — not the default data point marker that displays the numeric value, but an arbitrary string (e.g., “This is my test 1”, “This is my test 2”, etc., see image 2).
My questions:
-
Is it possible to do this using annotations in ActiveReports charts?
-
Can an annotation be anchored to a specific bar/data point so it stays attached when the chart layout changes (different number of series/categories, resizing, etc.)?
-
If annotations are not the right approach: What is the recommended / best-practice solution for placing custom text labels per bar in a Section Report chart?
Any hints, examples, or documentation links would be very helpful.
Thank you!
Regards, Alexander