WPF Step Chart
Step charts use horizontal and vertical lines to present data that show sudden changes along y-axis by discrete amount. These charts help display changes that are sudden and irregular but stay constant till the next change. Step charts enable judging trends in data along with the duration for which the trend remained constant.
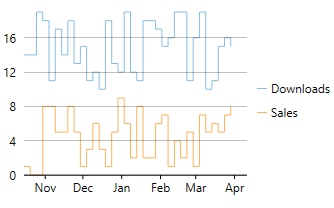
Consider a use case where you want to visualize and compare weekly sales and units downloaded of a software. As both of these values vary with discrete amounts, you can use step chart to visualize them. As shown in the image below, apart from depicting the change in sales these charts also show the exact time of change and the duration for which sales were constant. Moreover, you can easily identify the magnitude of respective changes by simply looking at the chart.
FlexChart supports Step chart, StepSymbols chart, and StepArea or filled step chart. The following table gives detailed explanation of these chart types.
 Step Chart Step Chart |
Step chart is similar to the Line chart, except that Line chart uses shortest distance to connect consecutive data points, while Step chart connects them with horizontal and vertical lines. These horizontal and vertical lines give the chart step-like appearance. While the line charts depict change and its trend, the Step charts also help in judging the magnitude and the intermittent pattern of the change. |
|---|---|
 StepSymbols Chart StepSymbols Chart |
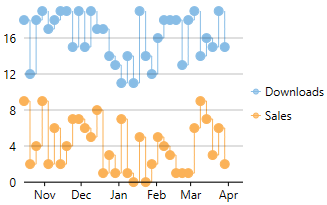
StepSymbols chart combines the Step chart and the Scatter chart. FlexChart plots data points by using symbols and connects those data points with horizontal and vertical step lines. Here, the data points are marked using symbols and, therefore, help mark the beginning of an intermittent change. |
 StepArea Chart StepArea Chart |
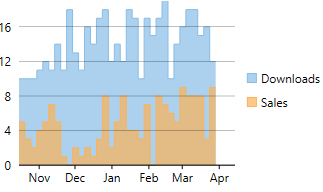
StepArea chart combines the Step chart and the Area chart. It is similar to Area chart with the difference in the manner in which data points are connected. FlexChart plots the data points using horizontal and vertical step lines, and then fills the area between x-axis and the step lines. These are based on Step charts, and are commonly used to compare discrete and intermittent changes between two or more quantities. This gives the chart stacked appearance, where related data points of the multiple series seem stacked above the other. For example, number of units downloaded and sales of a software for a particular time duration can be easily compared as shown in the image. |
To create WPF Step chart, you need to populate appropriate data in chart and set the ChartType property to Step in XAML, at design-time, or using code. However, to create a StepArea or a StepSymbol chart, you need to set the ChartType property to StepArea or StepSymbols respectively.
xml
<c1:C1FlexChart x:Name="flexChart"
                BindingX="Date"
                ItemsSource="{Binding DataContext.Data}"
                ChartType="Step"
                HorizontalAlignment="Stretch" Margin="5,5,5,195">
    <c1:C1FlexChart.Series>
        <c1:Series SeriesName="Downloads" Binding="Downloads"></c1:Series>
        <c1:Series SeriesName="Sales" Binding="Sales"></c1:Series>
    </c1:C1FlexChart.Series>
</c1:C1FlexChart>
csharp
flexChart.ChartType = C1.Chart.ChartType.Step;


