
WPF HighLowOpenClose Chart
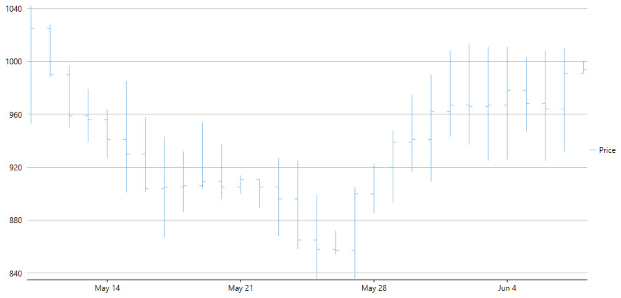
The HighLowOpenClose Chart is generally used in stock analysis. The chart combines four independent values to supply high, low, open, and close data values for each data point in a series.
WPF HighLowOpenClose Chart
See the following code for implementing the scenario:
xml
<c1:C1FlexChart x:Name="flexChart"
                BindingX="Time"
                ItemsSource="{Binding DataContext.Data}"
                ChartType="HighLowOpenClose">
    <c1:C1FlexChart.Series>
        <c1:Series SeriesName="Price"
                   Binding="High,Low,Open,Close"/>
    </c1:C1FlexChart.Series>
</c1:C1FlexChart>
Code
flexChart.ChartType = C1.Chart.ChartType.HighLowOpenClose;