
WPF LineSymbols Chart
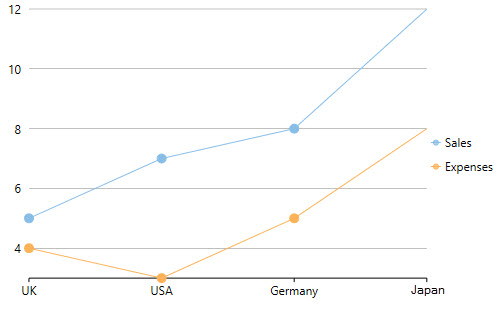
The LineSymbols Chart is a combination of the Line Chart and the Scatter Chart. The chart displays trends in data at equal intervals and visualizes relationship between two variables related to the same event. It plots data points by using symbols and connects the data points by using straight lines.
You need to set the ChartType property to LineSymbols either at design-time, in XAML, or at run-time to create the LineSymbols Chart.
You can set the Stacking property to Stacked or Stacked100pc to create the stacking WPF LineSymbols Chart.
WPF LineSymbols Chart
Below is the implementation in code:
xml
<c1:C1FlexChart x:Name="flexChart"
                BindingX="Country"
                ItemsSource="{Binding DataContext.Data}"
                ChartType="LineSymbols">
    <c1:C1FlexChart.Series>
        <c1:Series SeriesName="Sales"
                   Binding="Sales"/>
        <c1:Series SeriesName="Expenses"
                   Binding="Expenses"/>
    </c1:C1FlexChart.Series>
</c1:C1FlexChart>
Code
flexChart.ChartType = C1.Chart.ChartType.LineSymbols;