- WPF FlexChart Overview
- Getting Started with WPF Edition
- FlexChart
- FlexPie
- Sunburst Chart
- FlexRadar
- TreeMap
Axes Grid Lines
Axes grid lines extend from any vertical or horizontal axis across the plot area of the chart. They are displayed for major and minor units and aligned with major and minor tick marks displayed on the axes. These auxiliary lines form a grid that improves the readability of the chart, especially when you are looking for exact values.

Primarily, axes grid lines are of two types: major grid lines and minor grid lines. The lines parallel to major tick marks at major unit intervals are major gridlines, while those perpendicular to minor tick marks at minor unit intervals are minor grid lines.
In FlexChart, major grid lines are controlled by the MajorGrid property, while minor grid lines are controlled by the MinorGrid property. Using these properties, you can display horizontal as well as vertical grid lines to make the FlexChart data easier to read.
The code below illustrates how to set these properties.
csharp
//Hiding horizontal GridLines for AxisY
 flexChart.AxisY.MajorGrid = true;
 flexChart.AxisY.MinorGrid = false;
//Hiding vertical GridLines for AxisX
 flexChart.AxisX.MajorGrid =true;
 flexChart.AxisX.MinorGrid = false;
xaml
TAB CAPTION
<c1:C1FlexChart.AxisX>
   <c1:Axis Title="Januay 2019" MajorGrid="False" MinorTickMarks="None" MajorTickMarks="Outside" Format="MMMM dd">
    </c1:Axis>
</c1:C1FlexChart.AxisX>
<c1:C1FlexChart.AxisY>
    <c1:Axis Title="Precipitation (in mm)" MajorGrid="True" MinorTickMarks="Cross" MajorTickMarks="Cross">
    </c1:Axis>
</c1:C1FlexChart.AxisY>
Styling Grid Lines
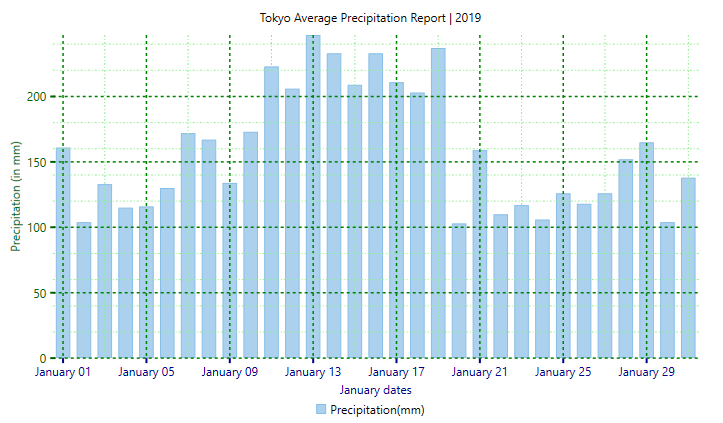
FlexChart allows you to style both major and minor grid lines as shown in the image below.

The appearances of the major and the minor grid lines are controlled by the MajorGridStyle and the MinorGridStyle property respectively. To style the grid lines, you can add the following code.
csharp
flexChart.AxisX.MinorGridStyle = new ChartStyle()
 {
      Stroke = Brushes.LightGreen,
      StrokeThickness = 1,
      LinePattern = LinePatternEnum.DashDot
 };
 flexChart.AxisY.MinorGridStyle = new ChartStyle()
 {
      Stroke = Brushes.LightGreen,
     StrokeThickness = 1,
      LinePattern = LinePatternEnum.DashDot
 };
flexChart.AxisX.MajorGridStyle = new ChartStyle()
{
      Stroke = Brushes.Green,
      StrokeThickness = 1.5d,
      LinePattern = LinePatternEnum.Dash,
 };
flexChart.AxisY.MajorGridStyle = new ChartStyle()
 {
      Stroke = Brushes.Green,
      StrokeThickness = 1.5d,
      LinePattern = LinePatternEnum.Dash,
 };
xaml
TAB CAPTION
<c1:Axis.Style>
    <c1:ChartStyle Stroke="DarkBlue" StrokeThickness="2" LinePattern="Dot">
    </c1:ChartStyle>
</c1:Axis.Style>
<c1:Axis.Style>
    <c1:ChartStyle Stroke="DarkGreen" StrokeThickness="2" LinePattern="Dot">
    </c1:ChartStyle>
</c1:Axis.Style>


