DataViewsJS - Gantt Column Plugin
We are pleased to announce DataViewsJS, the newest product in our JavaScript product line. DataViewsJS is the ultimate JavaScript data presentation control.
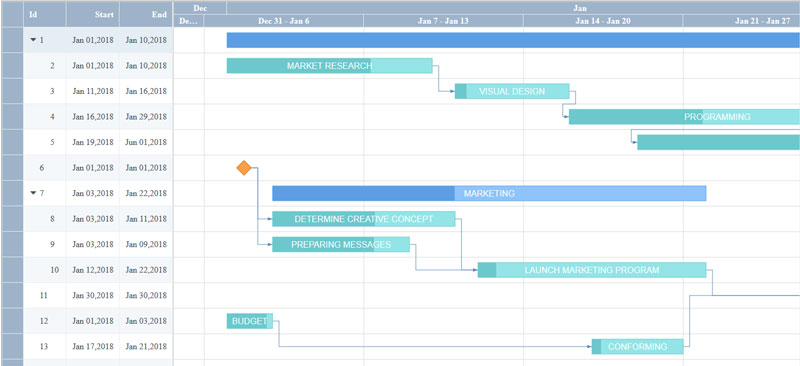
Planning and allocating resources can be made easier by using a Gantt view. With the new release of DataViewsJS, the Gantt chart can be easily created in just a few steps with the Gantt column type plugin. The example in this blog shows how you can utilize this functionality to create a product management outline.
Read the full release

Setting Up the Project
To start off, the Common and Core libraries for DataViewsJS will have to be referenced:
<script src="./static/dataviews/gc.dataviews.common.min.js" type="text/javascript"></script>
<script src="./static/dataviews/gc.dataviews.core.min.js" type="text/javascript"></script>
In addition, this particular demo uses the Grid layout, so that will need to be referenced as well:
<script src="./static/dataviews/gc.dataviews.grid.min.js" type="text/javascript"></script>
Finally the DataViewsJS library that contains the Gantt functionality will need to be referenced:
<div id="grid" style="width: 1500px; height: 800px; border: 1px solid gray"></div>
<script src="data.js" type="text/javascript"></script>
<script src="app.js" type="text/javascript"></script>
Adding Data
The data for the sample is implemented in a separate JS file called "data.js." This contains an array of objects that will represent entries in the Gantt chart, with start and end dates as well as how much of the task is complete and who is assigned to it:
var data = [
  {
    id: '1',
    description: 'SITE DESIGN',
    start: 'Jan 01,2018',
    end: 'Jan 10,2018',
    percentComplete: 0.3,
    resources: 'Steve, David, Wilson, Clark, Smith',
  },
...
]
Creating the Gantt Chart
The main code for actually creating the chart will be in a separate file called "app.js."
We can start by creating the column template that will hold the data in the grid:
var cols = [
  {
    id: 'id',
    caption: 'Id',
    dataField: 'id',
    width: 80,
  },
  {
    id: 'start',
    caption: 'Start',
    dataField: 'start',
    width: 100,
    dataType: 'date',
    format: 'mmm dd,yyyy',
  },
  {
    id: 'end',
    caption: 'End',
    dataField: 'end',
    width: 100,
    dataType: 'date',
    format: 'mmm dd,yyyy',
  },
  {
    id: 'gantt',
    ganttColumn: {
      timeLineScale: 'month',
      scale: 300,
      start: 'start',
      end: 'end',
      text: 'description',
    },
    width: '*',
  },
  {
    id: 'description',
    caption: 'Description',
    dataField: 'description',
    visible: false,
  },
  {
    id: 'resources',
    caption: 'Resources',
    dataField: 'resources',
    visible: false,
  },
  {
    id: 'predecessorID',
    caption: 'predecessorID',
    dataField: 'predecessorID',
    visible: false,
    allowEditing: false,
  },
  {
    id: 'parentID',
    caption: 'parentID',
    dataField: 'parentID',
    visible: false,
    allowEditing: false,
  },
];
In this column template, the Gantt chart is created via the column definition above:
{
    id: 'gantt',
    ganttColumn: {
      timeLineScale: 'month',
      scale: 300,
      start: 'start',
      end: 'end',
      text: 'description',
    },
    width: '*',
},
The layout of the grid can also be created in this file as well:
var layout = new GC.DataViews.GridLayout({
  colHeaderHeight: 48,
  rowHeight: 48,
  allowEditing: true,
  editRowTemplate: '#popupTemplate',
  editMode: 'popup',
  hierarchy: {
    keyField: 'id',
    parentField: 'parentID',
    collapsed: false,
    column: 'id',
    footer: {
      visible: false,
    },
  },
});
This layout will essentially tell the grid how to be formatted, and in this case how the hierarchy in the grid is structured.
Once we have the data, the column template, and the layout, we can create the instance using all three:
new GC.DataViews.DataView(document.getElementById('grid'), data, cols, layout);
This will result in a DataViewsJS instance with hierarchical data and a Gantt chart. These are all the steps you need to create your own Gantt chart in DataViewsJS.
This is just one of the many different implementations of DataViewsJS, to try out more for yourself, download a trial of DataViewsJS today!
Read more about DataViewsJS:
DataViewsJS Demos | DataViewsJS Documentation
