DataViewsJS - Trellis Layout
We are pleased to announce DataViewsJS, the newest product in our JavaScript product line. DataViewsJS is the ultimate JavaScript data presentation control.
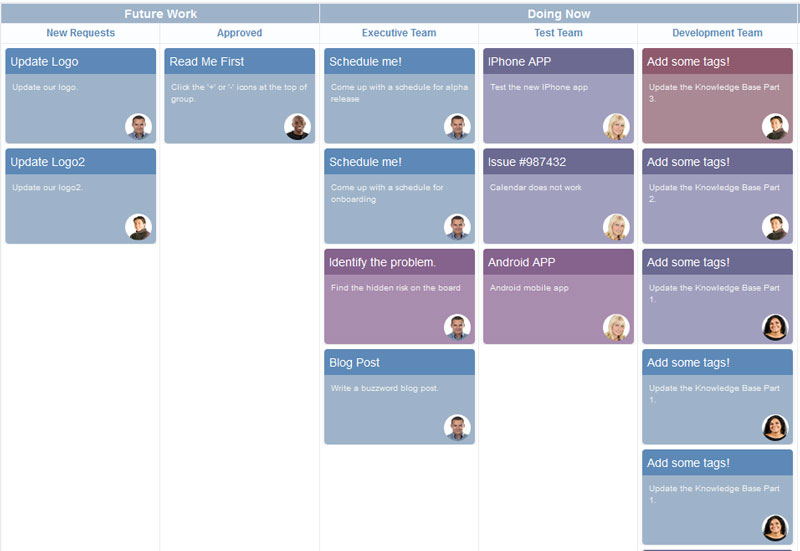
When trying to organize the workload in a team, a Kanban board can make the task much easier. In DataViewsJS, the Trellis grouping strategy combined with the Grid layout engine gives you the power to create this kind of organization. With this implementation, cards are organized into vertical lists in a grid view, allowing the user to drag and drop cards from different columns depending on what is being worked on.

Setting Up the Project
Before we start adding data and demo code, we will need to reference the Common and Core DataViews libraries, as well as the Grid and Trellis libraries:
<script src="./static/dataviews/gc.dataviews.common.min.js" type="text/javascript"></script>
<script src="./static/dataviews/gc.dataviews.core.min.js" type="text/javascript"></script>
<script src="./static/dataviews/gc.dataviews.grid.min.js" type="text/javascript"></script>
<script src="./static/dataviews/gc.dataviews.trellis.min.js" type="text/javascript"></script>
We should also reference the CSS files associated with these libraries:
<link rel="stylesheet" type="text/css" href="styles.css" />
To finish the setup, we can create a DIV element to contain the DataViewsJS instance, as well as references to the app.js and data.js files that we will be creating in this tutorial:
<div id="grid" style="width: 1500px; height: 800px; border: 1px solid gray"></div>
<script src="data.js" type="text/javascript"></script>
<script src="app.js" type="text/javascript"></script>
Adding Data
var data = [
   {
     work: 'Future Work',
     category: 'New Requests',
     description: 'Update our logo.',
     title: 'Update Logo',
     photo: './images/ds.jpg',
     progress: 0,
   },
   ...]
Creating the Kanban Board
The code for creating the Kanban Board will be contained in a file called app.js. To create the dataView instance, we have to provide the data (which has already been defined), the columns, and the layout.
First we can define the columns:
var cols = [
  {
    id: 'title',
    name: 'title',
    dataField: 'title',
  },
  {
    id: 'description',
    name: 'description',
    dataField: 'description',
  },
  {
    id: 'photo',
    dataField: 'photo',
    presenter: photoPresenter,
  },
  {
    id: 'progress',
    dataField: 'progress',
  },
];
In this case, the photo column data is obtained from a database containing the photos, and we can define the presenter as so:
var photoPresenter = '<img class="employee-photo" src=\{{=it.photo}} />';
The layout requires a row template and a grouping strategy. The row template can be defined as a string of HTML code:
var rowTemplate =
  '<div class="group-item-container">\n  <div class="group-item-container-inner \{{? it.progress==100}}finish\{{?? it.progress>=80}}eighty-per\{{?? it.progress>=50}}fifty-per\{{?? it.progress>=30}}thirty-per\{{??}}start\{{?}}">\n    <div data-column="title" class="group-item-title"></div>\n    <div data-column="photo" class="group-photo-container"></div>\n    <div data-column="description" class="group-item-description"></div>\n  </div>\n</div>';
Then the layout determines how the groups are organized and to use the Trellis grouping strategy:
var layout = new GC.DataViews.GridLayout({
  grouping: [
    {
      field: 'work',
      header: {
        height: 24,
      },
      footer: {
        visible: false,
      },
    },
    {
      field: 'category',
      header: {
        height: 24,
      },
      footer: {
        visible: false,
      },
    },
  ],
  rowTemplate: rowTemplate,
  rowHeight: 120,
  groupStrategy: trellis,
});
With the data, columns, and layout defined, the board can be created in the "grid" DIV element with one line:
var dataView = new GC.DataViews.DataView(document.getElementById('grid'), data, cols, layout);
That's all that is needed to create your own Kanban board with DataViewsJS! Make sure to download the trial of DataViewsJS to get access to this feature and more!
Read more about DataViewsJS:
DataViewsJS Demos | DataViewsJS Documentation
