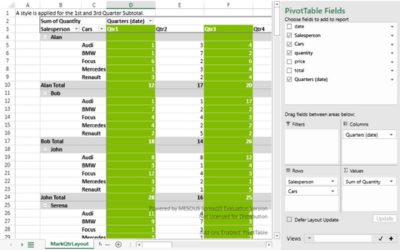
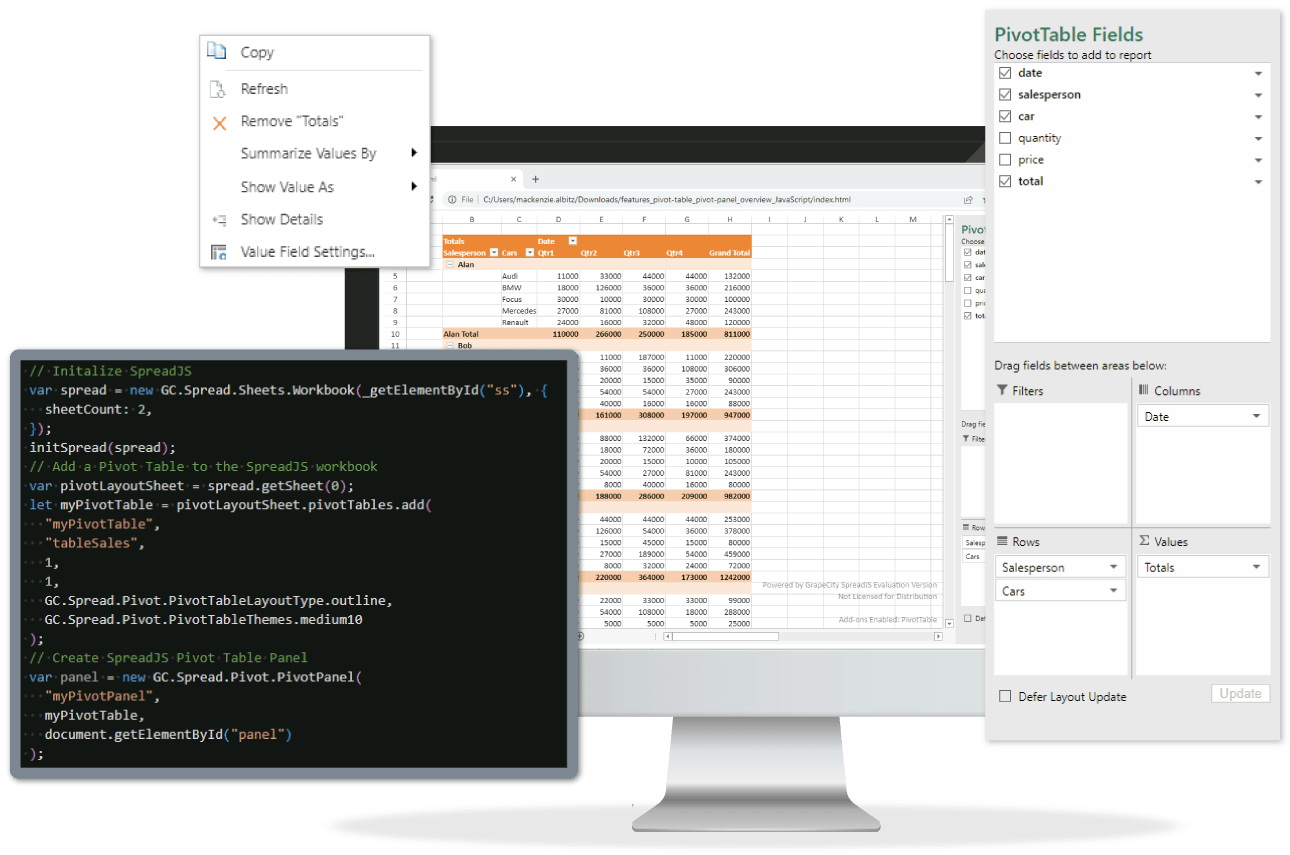
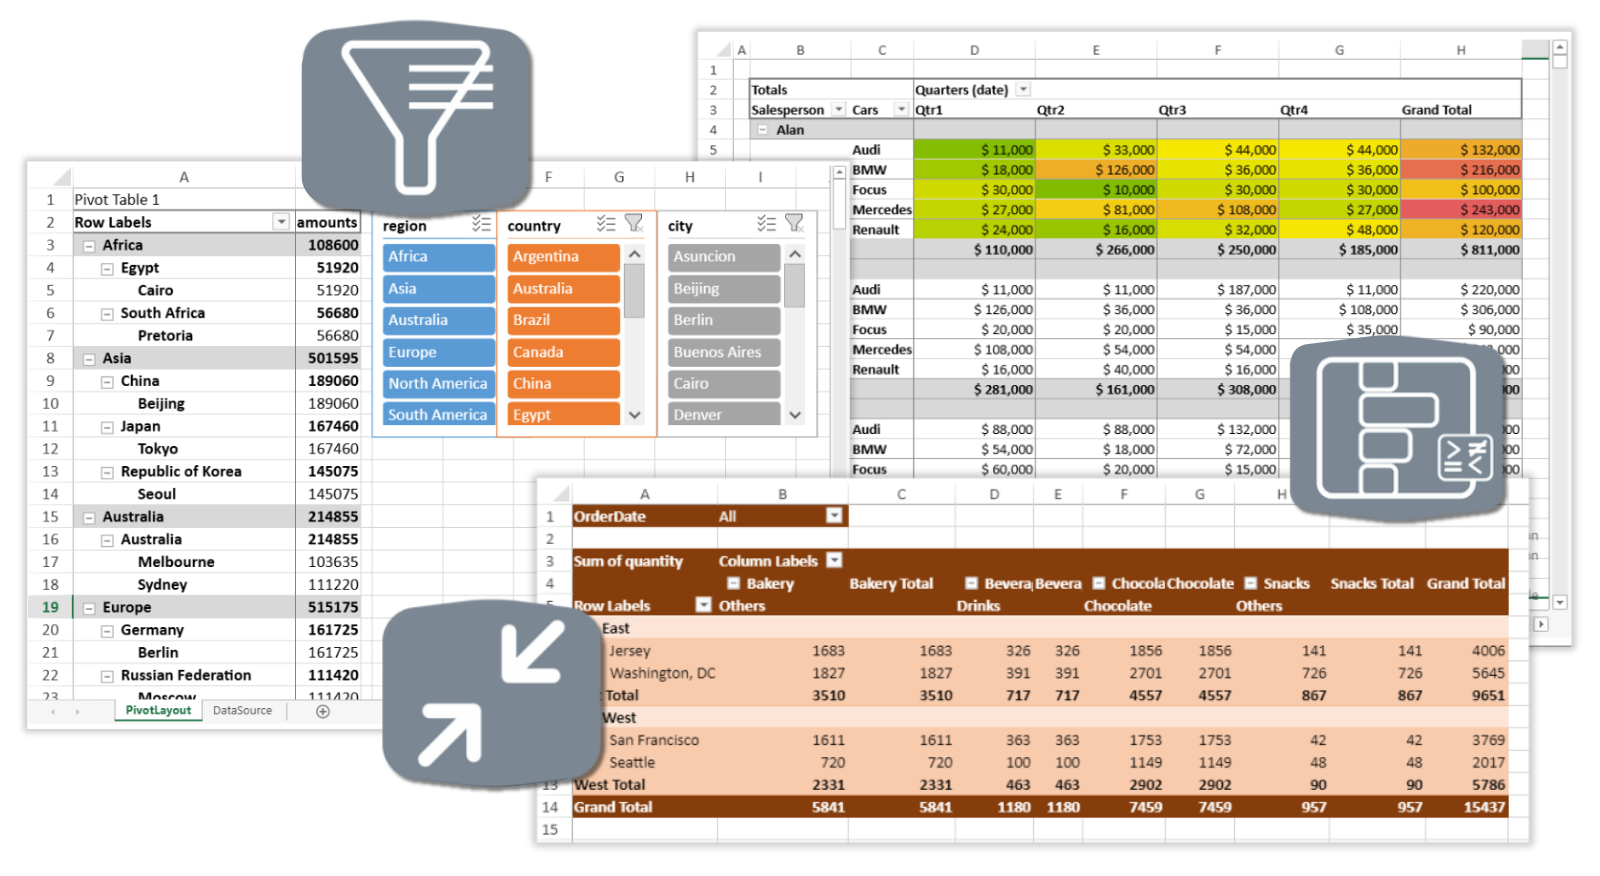
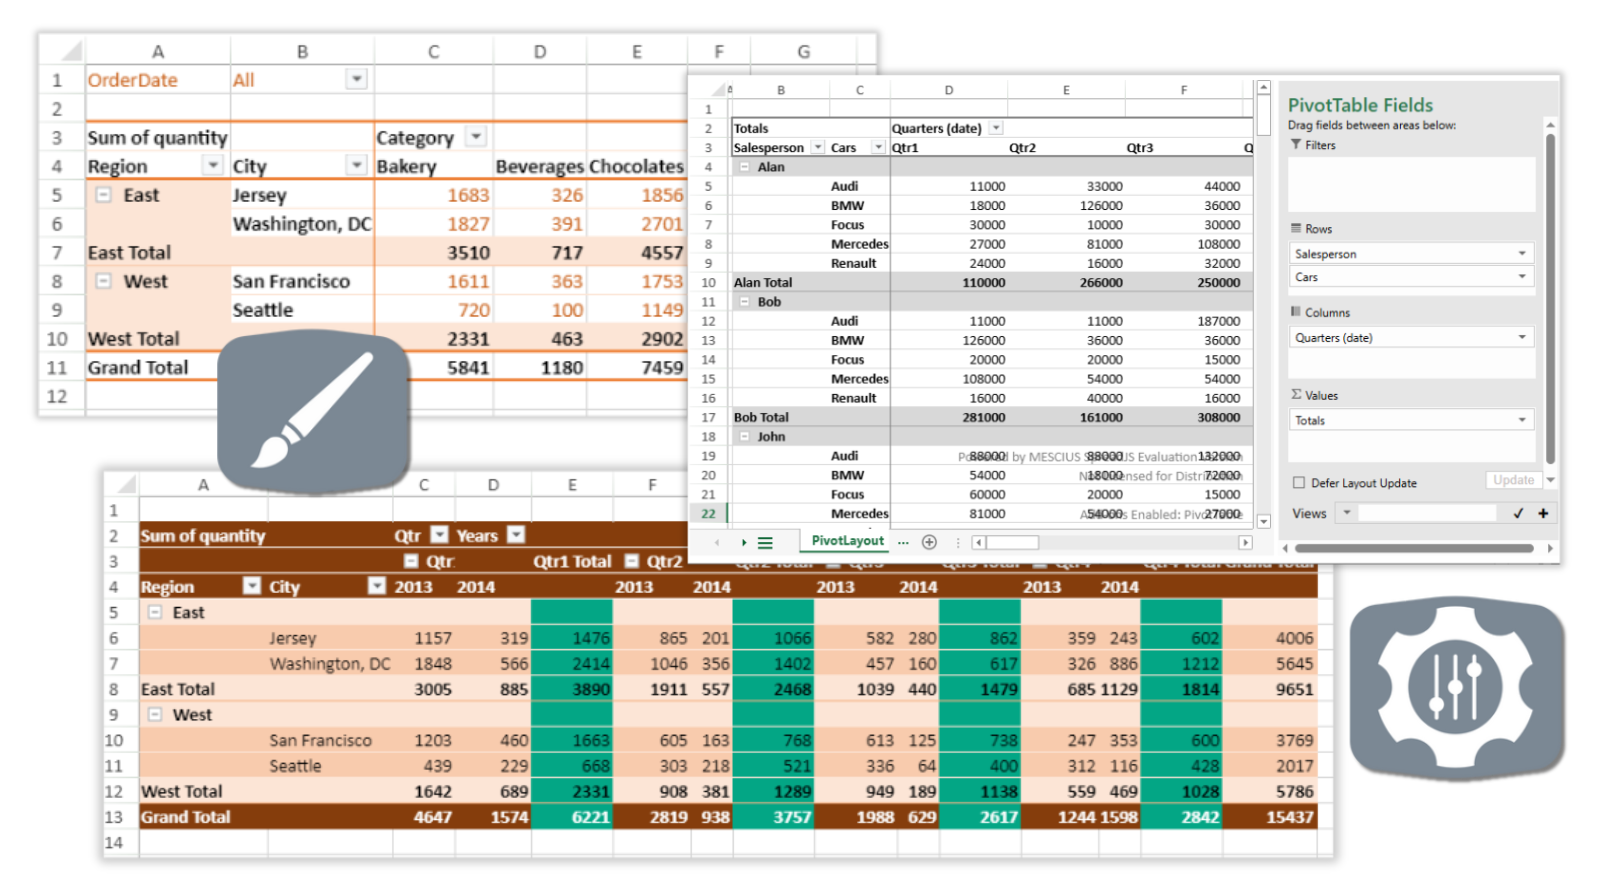
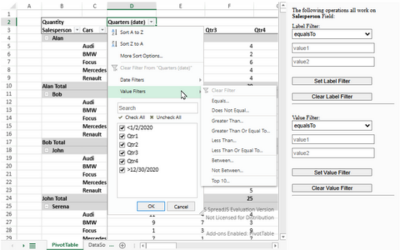
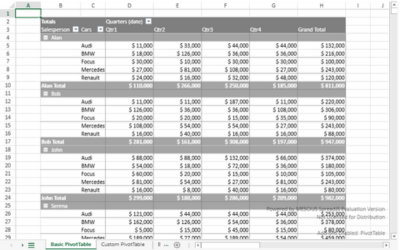
Skip to main content Skip to footer

Add Interactive JavaScript Pivot Tables in Your Web Apps

Add powerful Pivot Table functionality to your JavaScript Spreadsheet applications with this SpreadJS optional add-on—built for fast, flexible, and interactive data analysis.

  • Build dynamic, interactive JavaScript Pivot Tables for data analysis and dashboards.
  • Replicate familiar Pivot Table UI and behavior with support for subtotals, grand totals, sorting, and formatting.
  • Seamlessly integrate into modern JavaScript frameworks with no dependencies on Excel or server processing.
Download SpreadJS Free Trial (V 18.1.4)

Explore Powerful JavaScript Pivot Table Capabilities

Pivot Tables help users summarize, group, and analyze complex datasets in a structured, interactive way. The optional SpreadJS Pivot Table add-on brings Excel-like pivot capabilities to your JavaScript spreadsheets, with built-in field panels, aggregations, and calculated fields. Create fast, customizable reports with a familiar UI and full .xlsx support—all right in the browser.

Ultimate Pivot Table Solution

Familiar Pivot Table UI and Experience in Web Applications

Familiar Pivot Table UI and Experience

Give users an intuitive, Excel-like spreadsheet experience with built-in pivot panels, context menus, field lists, and drag-and-drop functionality. The component supports common pivot table operations and data aggregation, empowering users to create interactive, dynamic reports in seconds. Developers can also customize the pivot panel’s layout and behavior to match their application’s needs.

Full Set of Enterprise Features

Provide Pivot Table features in a spreadsheet-like interface:

Enterprise Level JavaScript Spreadsheet Pivot Table Component
Fully Customize JS Pivot Table Control

Full Customization of the JavaScript Pivot Table

This optional Pivot Table control is fully customizable with the developer-friendly JavaScript spreadsheet API. Devs can modify the default Pivot Table UI presentation with specific parameters. Customize the appearance of the control filters, rows, columns, headers, side panel, and to any extent programmatically.

Build Your Own JavaScript Pivot Table

Quick Start Guide
1. Ensure the Necessary Packages are included in the SpreadJS application.

Download Full Trial 
NPM Packages: @mescius/spread-sheets@mescius/spread-sheets-pivot-addon

2. Create a container element in your HTML and initialize a SpreadJS JavaScript spreadsheet instance. <div id="ss"></div>
<script>
  var workbook = new GC.Spread.Sheets.Workbook(document.getElementById('ss'), { sheetCount: 2 });
</script>
3. Create a Pivot Table by defining the data source, start position, and options using SpreadJS’ PivotTable API. let myPivotTable = sheet.pivotTables.add(
   "myPivotTable", // Pivot Table Name
   "tableSales", // Pivot Table Data Source
   1, // Start row
   1, // Start column
  GC.Spread.Pivot.PivotTableLayoutType.outline, // Pivot Table Layout
  GC.Spread.Pivot.PivotTableThemes.light8 // Pivot Table Theme
);
4. Invoke the Add method to add fields to the JS Pivot Table. pivotTable.suspendLayout();
    pivotTable.add("platform", "Platform", GC.Spread.Pivot.PivotTableFieldType.rowField);
    pivotTable.add("genre", "Genre", GC.Spread.Pivot.PivotTableFieldType.rowField);
    pivotTable.add("sales", "Sales", GC.Spread.Pivot.PivotTableFieldType.valueField, GC.Pivot.SubtotalType.sum);
    pivotTable.add("price", "Price", GC.Spread.Pivot.PivotTableFieldType.valueField, GC.Pivot.SubtotalType.average);
pivotTable.resumeLayout();
5. The JavaScript spreadsheet now displays the Pivot Table with the defined fields. JavaScript Pivot Table Quick Start Example

Learn more with our complete quick start guide blogs - JavaScript, Angular, React, Vue

The Leading JavaScript Pivot Table Control

Easy Licensing & Distribution

After Purchasing Users Generate Pivot Table Enabled SpreadJS Distribution Key/s for Application/s Through Their MESCIUS Account.

Licensing FAQs

The Pivot Table add-on is enabled through a SpreadJS distribution key. SpreadJS is licensed per developer and deployed hostname, with deployment licenses varying by commercial or non-commercial use.

Learn More About Optional Add-On Licensing.

Request a Pivot Table Enabled Trial Key

Our sales team can provide a 30-day Pivot Table Add-on enabled trial key upon request, allowing you to deploy SpreadJS and the optional Pivot Table add-on during your trial period.

Contact Our Sales Team

Have Questions? We're Here to Help

Email sales@mescius.com to schedule a call with our product specialists or request a personalized demo through support to discuss your project needs.

Contact Support

Award-Winning Products and First-Class Support

Five Star Rating

"I have been using a various form of Spread back to the COM days. Spread is the most reliable spreadsheet that retrieves and stores data, whether interacting with a database or simply an Excel file. Try it out, and you will not go back to any other control"

TRUSTED CUSTOMER

Five Star Rating

"Great support through evaluation process, Spread is my favorite development add-in, adds great, high value capabilities to applications!"

TRUSTED CUSTOMER

Five Star Rating

"Excellent Products. I have been using their products for around 15 years. Always there to help."

TRUSTED CUSTOMER

ComponentSource Award 2024 Top 50 Product Top 50 Product (#31) - Component Source 2025

Trusted by the World's Leading Companies

"Thanks for providing the best [JavaScript] spreadsheet widget in the world, we're very happy customers. Your product has saved us a TON of time relative to other solutions we used in the past."

Jan Domanski, Labstep