Posted 21 January 2019, 7:26 am EST - Updated 4 October 2022, 8:30 am EST
Hi
I’m building a chart that will take a data set from a text file, and show a number of charts in a single view.
Each chart will have a single data item displayed in it.
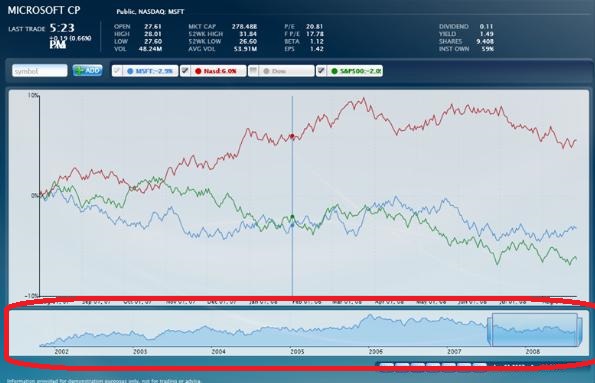
Below is your stocks chart. The bit I’m interested in replicating is the bottom part of the chart, circled in red.

What I’d like to be able to do is allow the user to add and remove as many of these charts as they’d like, and select the data item from a list that will be populated when the data set is loaded from a text file.
When a chart is added or removed, the rest of the charts must resize to be equally sized vertically.
The user must be able to zoom in and out on the chart, so that they can see detail of an area of the data, and then zoom back out to an overview.
All the charts must zoom in and out together, as the data items are all recorded at the same time.
Firstly, what is the chart type I would use to replicate that?
Secondly, is there anything I’ve mentioned above that would not be possible to implement using these chart objects?

