FlexChart – Custom Label Spacing and Values Like Old C1Chart UnitMajor / UnitMi

Posted by: andrea.davoli on 13 August 2025, 9:55 am EST

    • Post Options:
    • Link

    Posted 13 August 2025, 9:55 am EST

    Hi,

    In the old C1Chart I was able to use UnitMajor and UnitMinor to set the spacing between bars on the X or Y axis.

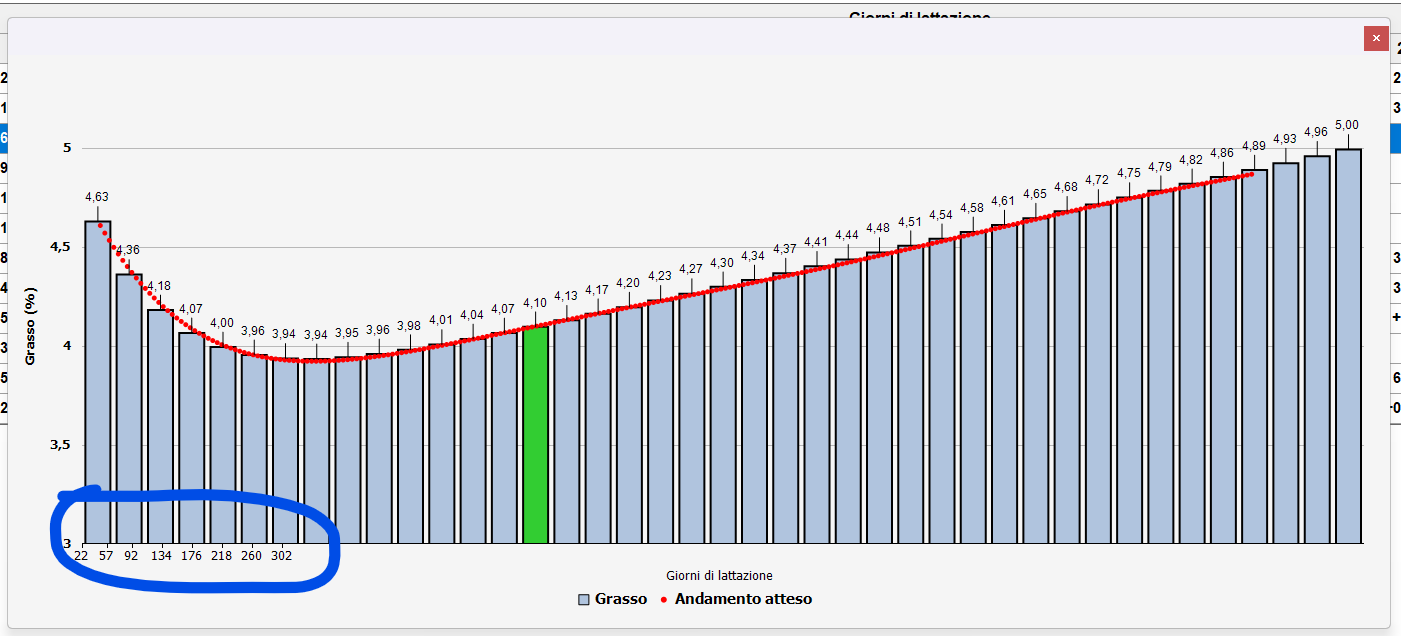
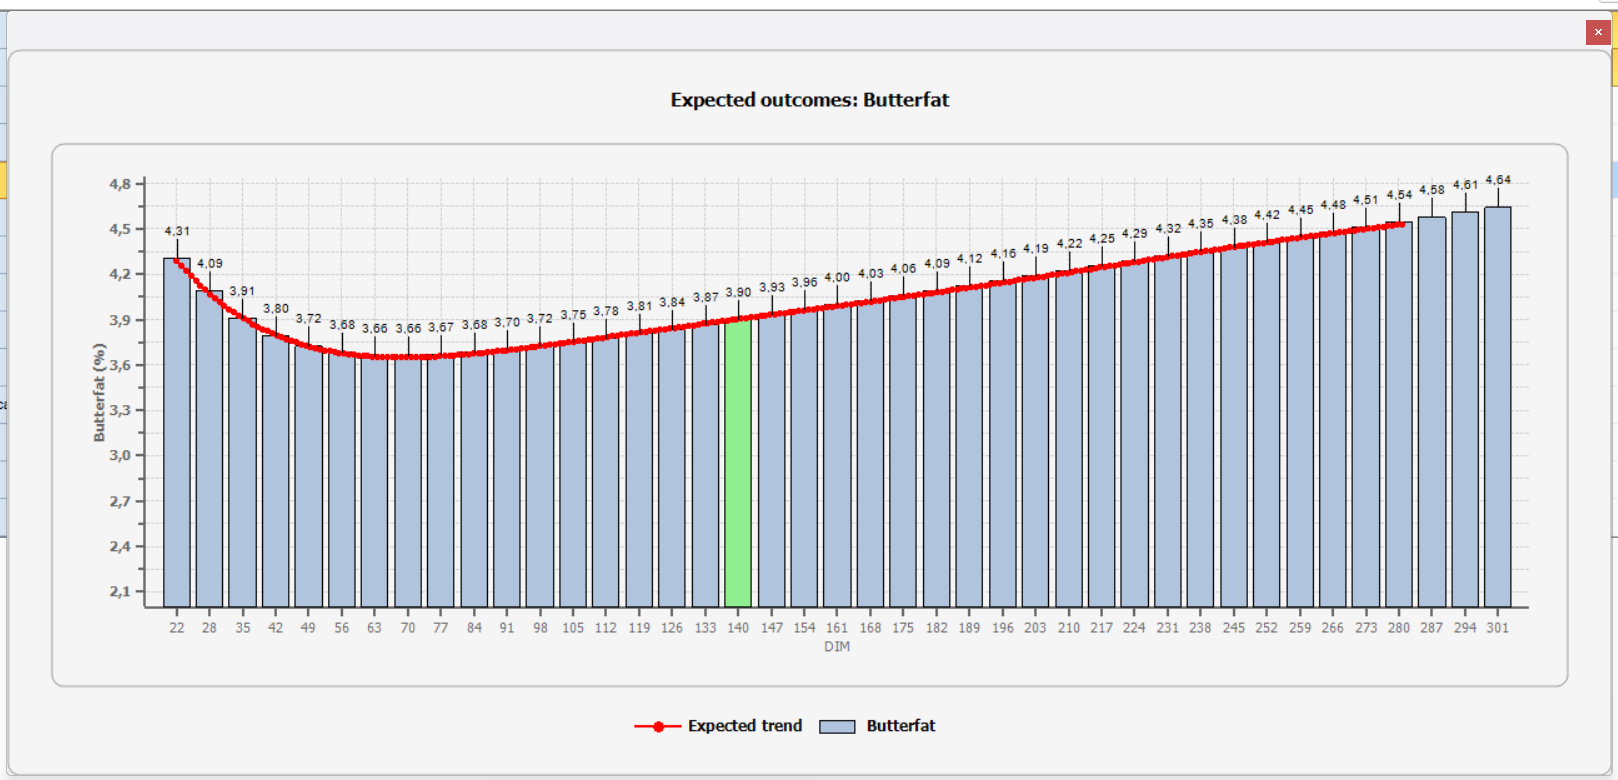
    Moreover, the label values shown on the axis could be set arbitrarily, not necessarily tied to the position of the major/minor grid lines — as in the example below:

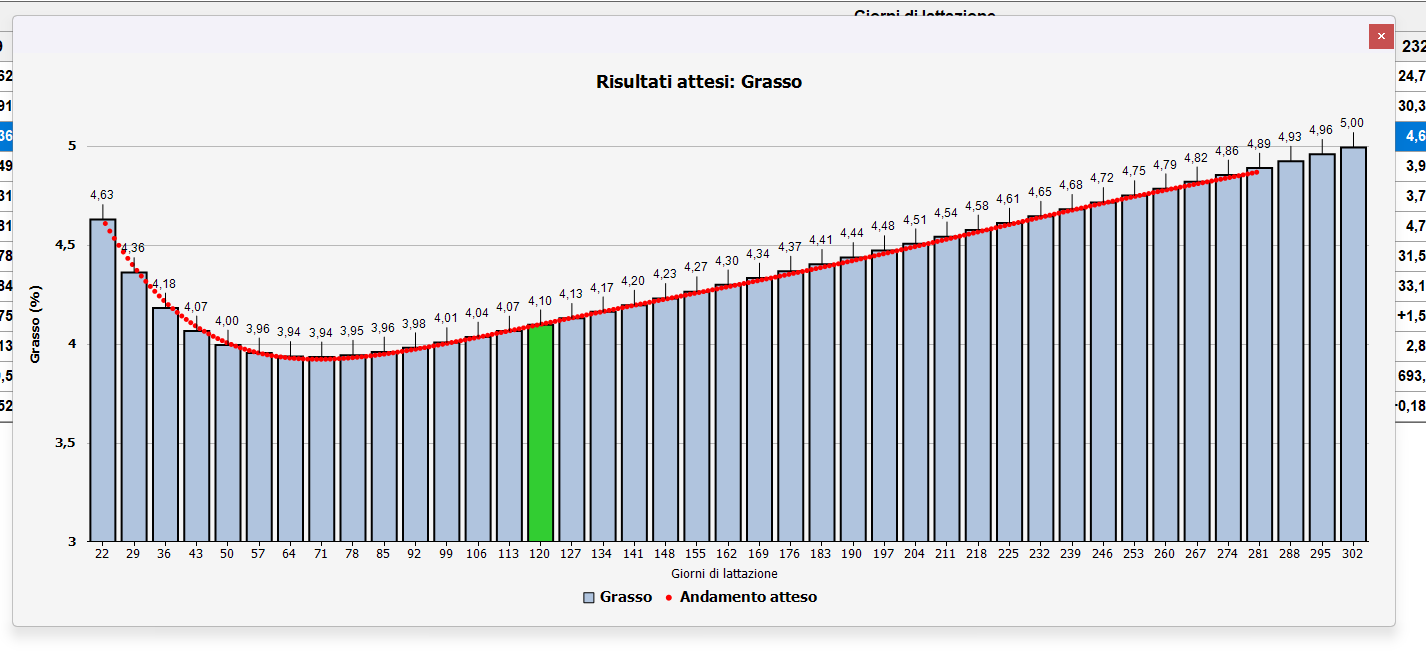
    This allowed me to achieve a result like this:

    With FlexChart, I cannot find the same functionality.

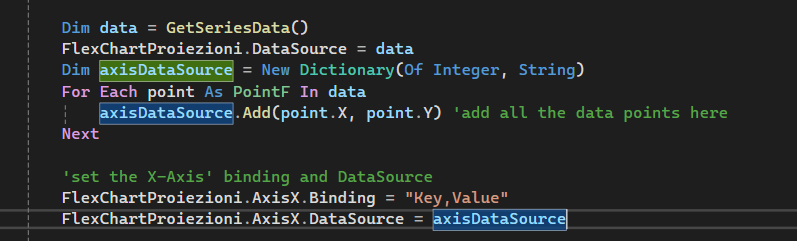
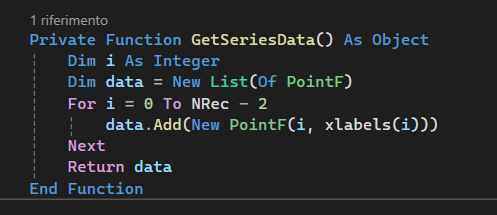
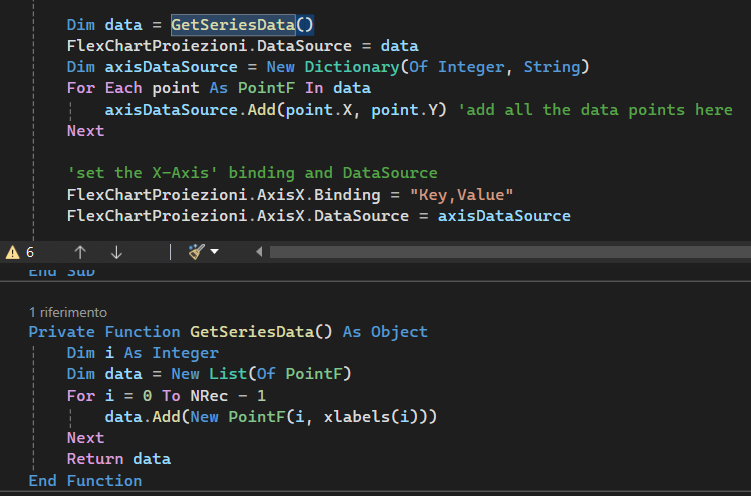
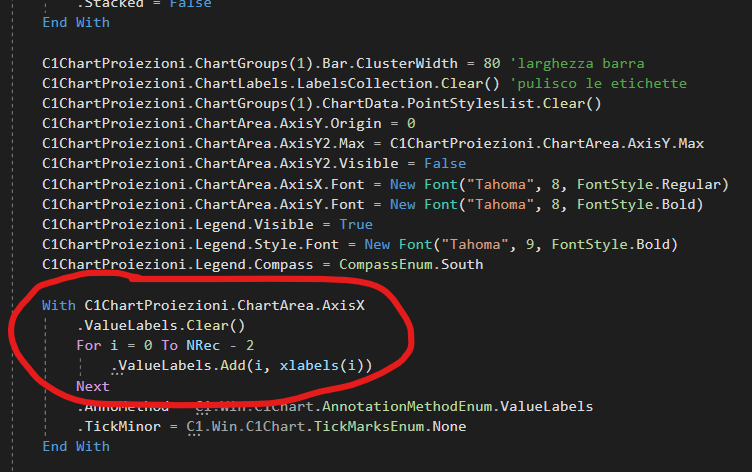
    The closest I get is by using MajorUnit and MinorUnit, but these seem fixed to the line spacing, so I cannot assign custom label values independently:

    Is there any way to replicate the old C1Chart behavior in FlexChart?

    Thanks in advance for your help!

  • Posted 14 August 2025, 7:54 am EST

    Hi Andrea,

    You can achieve the same behavior in FlexChart as shown in C1Chart by adding all the data points/labels for the X-axis to the FlexChart.AxisX.DataSource property. A Dictionary can be used to define these points, and you can set the FlexChart.AxisX.Binding property to “Key,Value” so that it maps the dictionary correctly.

    Please refer to the updated sample project from your previous thread - FlexChartMultipleSeries_Updated.zip

    Best Regards,

    Kartik

  • Posted 18 August 2025, 7:27 am EST - Updated 18 August 2025, 7:32 am EST

    Thank you for the reply,

    I added the code but this is the result


    no

    The code looks like ok, data are correct, but the result no, what am I doing wrong?

  • Posted 19 August 2025, 1:54 am EST

    Hi Andrea,

    Unfortunately, we were unable to reproduce the behavior you described in our sample project. It is difficult for us to investigate further without seeing your actual implementation and data source. Could you please update our sample project with your data along with the issue you are facing, so we can investigate further and assist you better?

    The only thing we noticed in your code is the line axisDataSource.Add(point.X, point.Y), which does not seem correct. You need to add all the X-Points as labels in the dictionary, and there is no need to include the Y-points. In our code, for example, we use axisDataSource.Add(point.X, point.X) instead.

    Best Regards,

    Kartik

  • Posted 22 August 2025, 4:38 am EST - Updated 22 August 2025, 4:43 am EST

    Thank you!

    I did this and now works!

Need extra support?

Upgrade your support plan and get personal unlimited phone support with our customer engagement team

Learn More

Forum Channels