Wijmo Olap Incorrect Average Issue

Posted by: eric.edgar on 22 December 2024, 3:16 pm EST

    • Post Options:
    • Link

    Posted 22 December 2024, 3:16 pm EST - Updated 22 December 2024, 11:19 pm EST

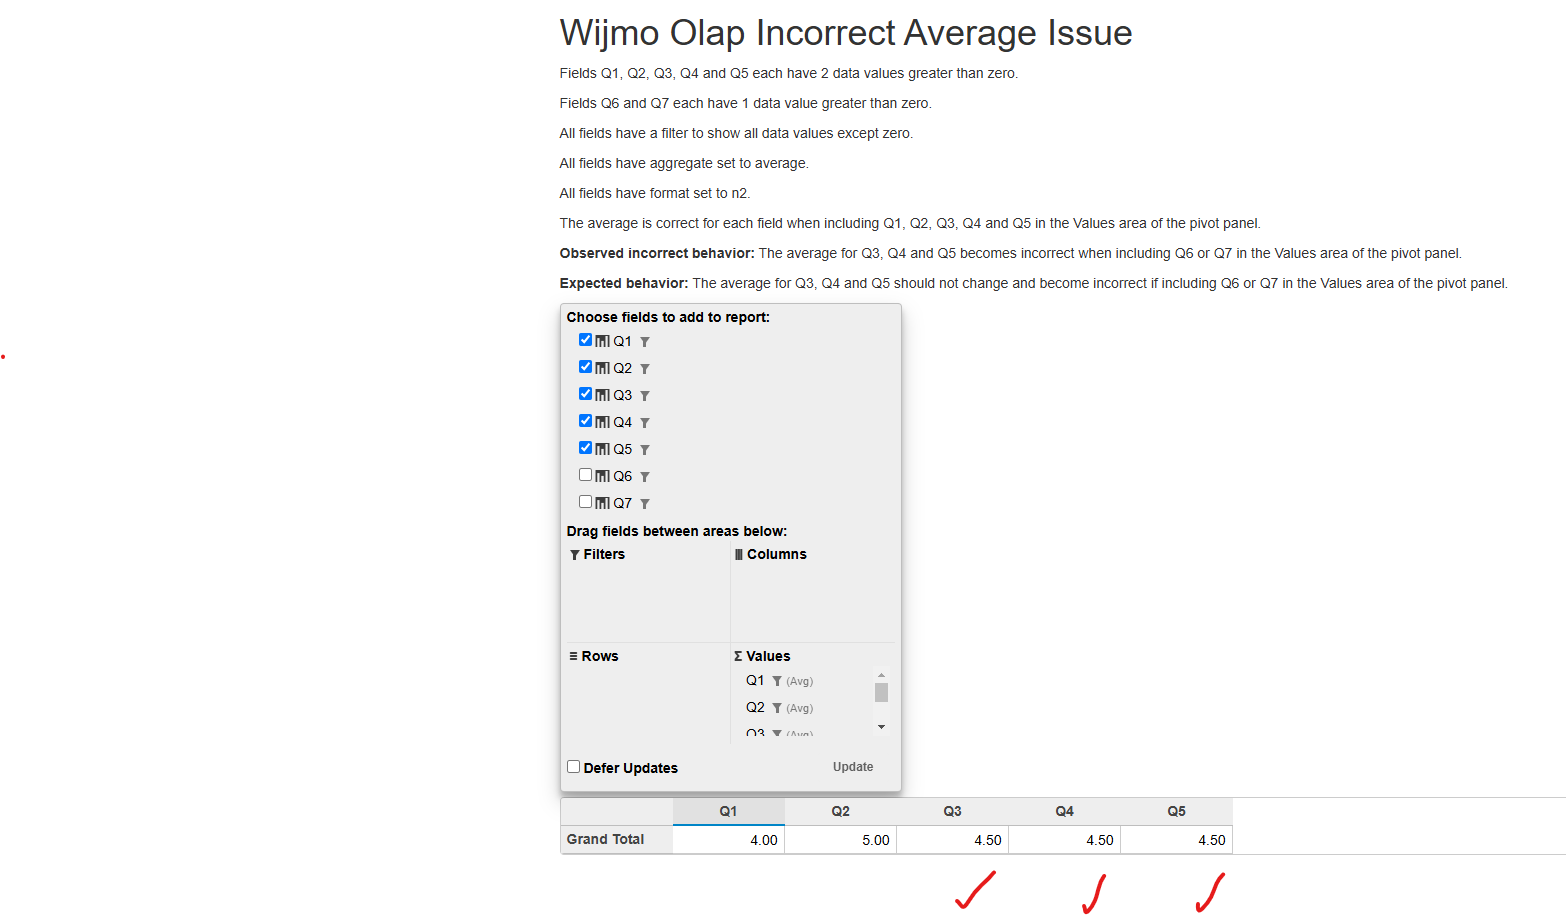
    Fields Q1, Q2, Q3, Q4 and Q5 each have 2 data values greater than zero.

    Fields Q6 and Q7 each have 1 data value greater than zero.

    All fields have a filter to show all data values except zero.

    All fields have aggregate set to average.

    All fields have format set to n2.

    The average is correct for each field when including Q1, Q2, Q3, Q4 and Q5 in the Values area of the pivot panel.

    Observed incorrect behavior: The average for Q3, Q4 and Q5 becomes incorrect when including Q6 or Q7 in the Values area of the pivot panel.

    Expected behavior: The average for Q3, Q4 and Q5 should not change and become incorrect if including Q6 or Q7 in the Values area of the pivot panel.

    See attached screenshots and jsfiddle

    https://jsfiddle.net/xcy321h0/

    Data:

    let data = ;

    //1

    data.push({

    Q1: 0,

    Q2: 0,

    Q3: 0,

    Q4: 0,

    Q5: 0,

    Q6: 0,

    Q7: 0

    });

    //2

    data.push({

    Q1: 0,

    Q2: 0,

    Q3: 0,

    Q4: 0,

    Q5: 0,

    Q6: 0,

    Q7: 0

    });

    //3

    data.push({

    Q1: 4,

    Q2: 5,

    Q3: 4,

    Q4: 4,

    Q5: 4,

    Q6: 5,

    Q7: 5

    });

    //4

    data.push({

    Q1: 0,

    Q2: 0,

    Q3: 0,

    Q4: 0,

    Q5: 0,

    Q6: 0,

    Q7: 0

    });

    //5

    data.push({

    Q1: 4,

    Q2: 5,

    Q3: 5,

    Q4: 5,

    Q5: 5,

    Q6: 0,

    Q7: 0

    });

    //6

    data.push({

    Q1: 0,

    Q2: 0,

    Q3: 0,

    Q4: 0,

    Q5: 0,

    Q6: 0,

    Q7: 0

    });

    //7

    data.push({

    Q1: 0,

    Q2: 0,

    Q3: 0,

    Q4: 0,

    Q5: 0,

    Q6: 0,

    Q7: 0

    });

  • Posted 23 December 2024, 9:03 am EST

    Hi Eric,

    It seems like it is an average calculation issue but actually, this is the expected behavior and not really an issue. This behavior is observed because filters are applied on the pivot fields which filter out items based on the filter show values and then the average is calculated based upon the data of remaining items. In the sample you shared, when fields from Q1 to Q5 are visible, the data source has such type of data that after applying the filters, only 2 items remain, based on which the average is calculated. But when you include Q6 or Q7, then only 1 item remains that passes all the filters (because Q6 or Q7 filter out 0 values, and there is only 1 item in data source that does not have 0 for Q6 and Q7), hence, the average calculation is changed.

    You’ll observe the same behavior with this data in an MS Excel file, we are attaching an Excel file for your reference.

    In case, if there is something we missed, please let us know.

    Regards

    Pivot_table.zip

  • Posted 26 December 2024, 7:03 pm EST

    Thank you, Vivek. I have passed on this information and spreadsheet to the customer that reported the issue.

    Regards,

    Eric

Need extra support?

Upgrade your support plan and get personal unlimited phone support with our customer engagement team

Learn More

Forum Channels