Posted 25 September 2018, 3:08 pm EST - Updated 3 October 2022, 8:22 pm EST
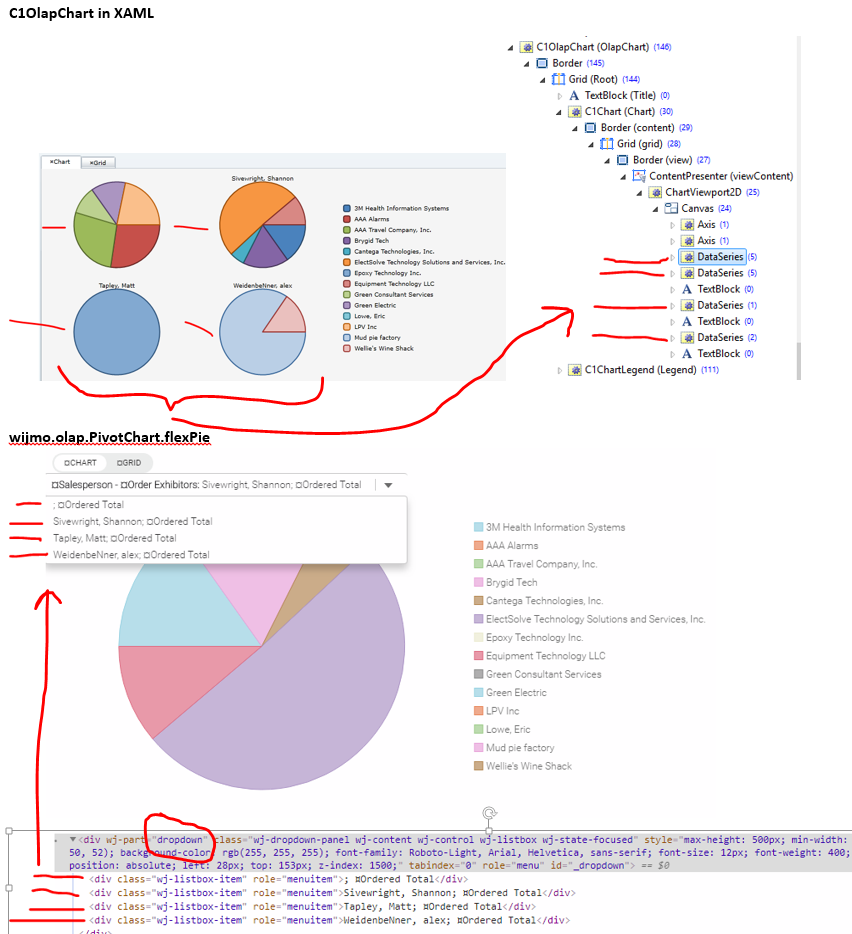
Greetings Wijmo. We are in the process of migrating our XAML application to HTML5. In the process of this we noticed a major change to the OLAP pie chart for a multiple data series scenario. In XAML, all pie charts display for each series at the same time on the C1OlapPanel. However, for the wijmo.olap.PivotChart, a dropdown contains each data series and only flexPie can be shown at once depending on which data series is selected in the dropdown.
See attached image.
Our customers would like to not have to cycle through the dropdown to see each pie chart one at a time. They would like to display all pie charts in the data series all at the same time. Is there a setting for wijmo.olap.PivotChart.flexPie to accomplish this in order to be backwards-compatible with the C1OlapPanel for pie charts?
Thank You