
Posted 23 September 2020, 5:46 am EST - Updated 30 September 2022, 9:39 am EST
Hi, Can anyone help on this one?
2015 v2
I have a wijmo grid being used for reporting purposes.
it is a generic reporting mechanism and the grid behaves as intended.
It uses groupings and totals (to various levels) (no paging we scroll)
We populate it with a datatable
The fields are generated from code behind as c1boundfield and applied to the grid then the datasource is bound
we do not autogenerate columns
Problem 1
When exporting to XLS using the service it generates an adequate look of the grid.
First Example
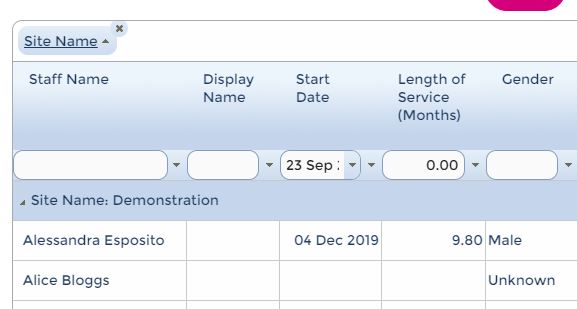
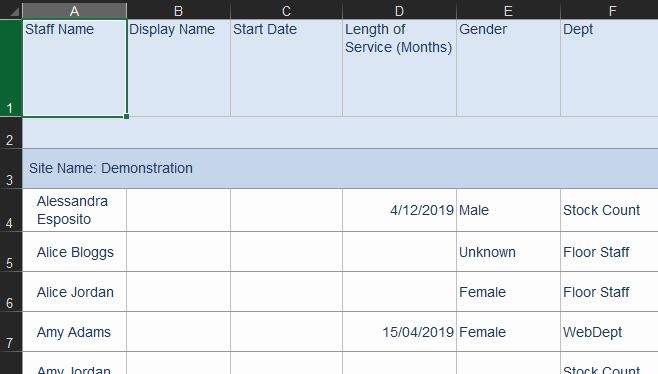
Image1 = grid
Image2 = XLS result
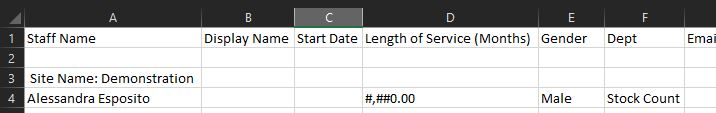
Image 3 = CSV result
The Start Date in the XL output has been shifted over by 1 column and overwrote the column alongside
in the below shot the start date is blank whereas the data contained a date
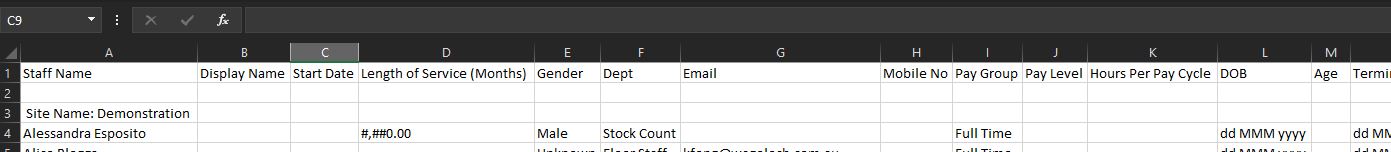
and the length of service coulmn is showing the formatstr instead of the values, in some columns its showing dd MMM yyyy instead of the date values
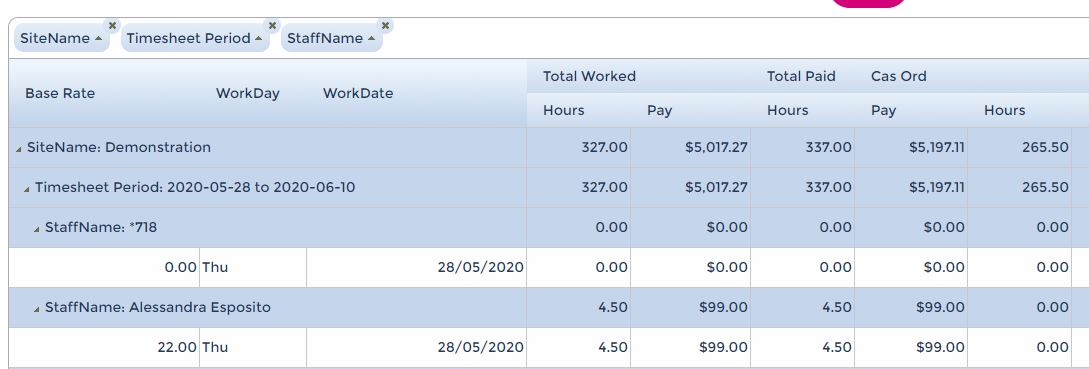
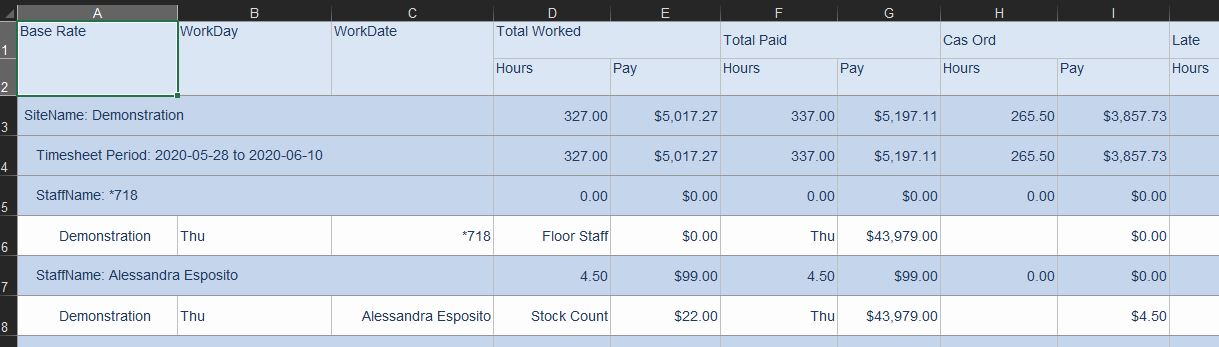
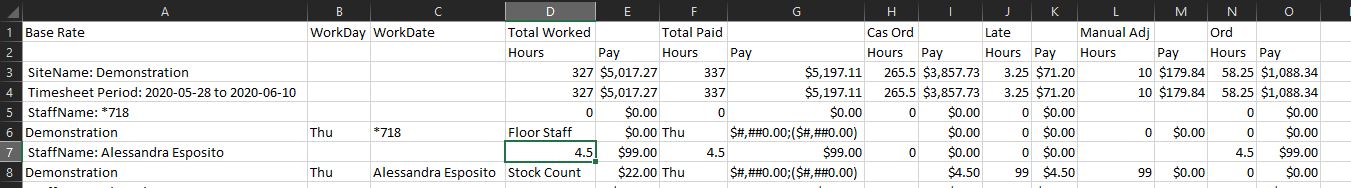
Problem 2
A more complex grid
But it too is incorrectly exported.
It seems all grouping columns are being included in the output for both XLS and CSV as art of the dtail, the result is missing information Such as Workdate being overwritten by staff name
First Image is the Grid
then XLS image
then CSV Image
Does anyone have any ideas?
Thanks for any help
Evan


