Further polishing on charts

Posted by: ic-s on 20 April 2018, 12:37 am EST

  • Posted 20 April 2018, 12:37 am EST - Updated 3 October 2022, 11:05 am EST

    Thanks Deepak for the feedback on blank cells in chart series,

    Could you look at the use Range Names in the chart series? I cannot build a chart in Spread.Sheets Designer with a range name used in a x or y series.

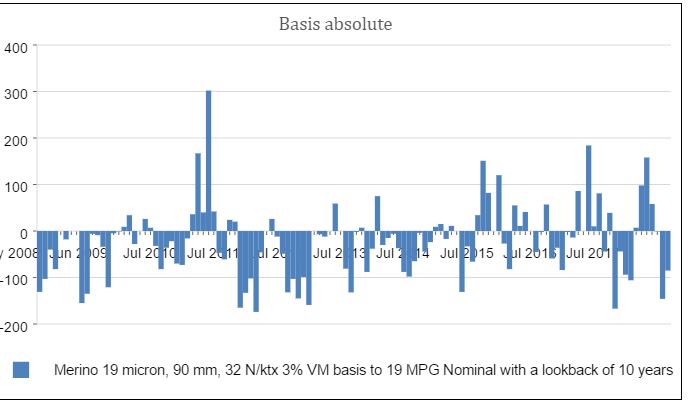
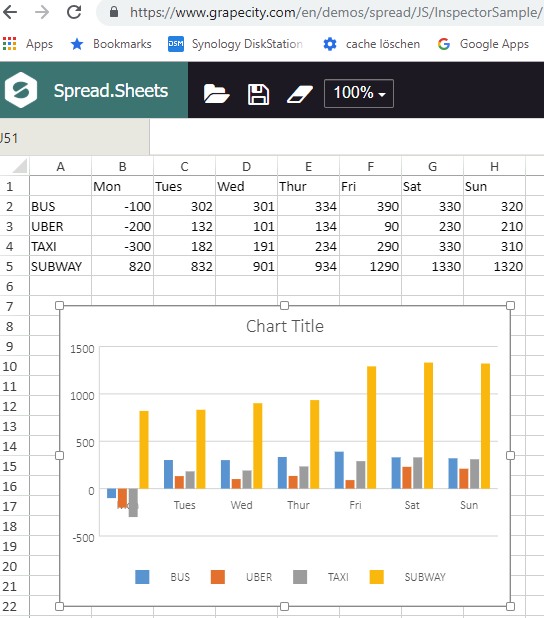
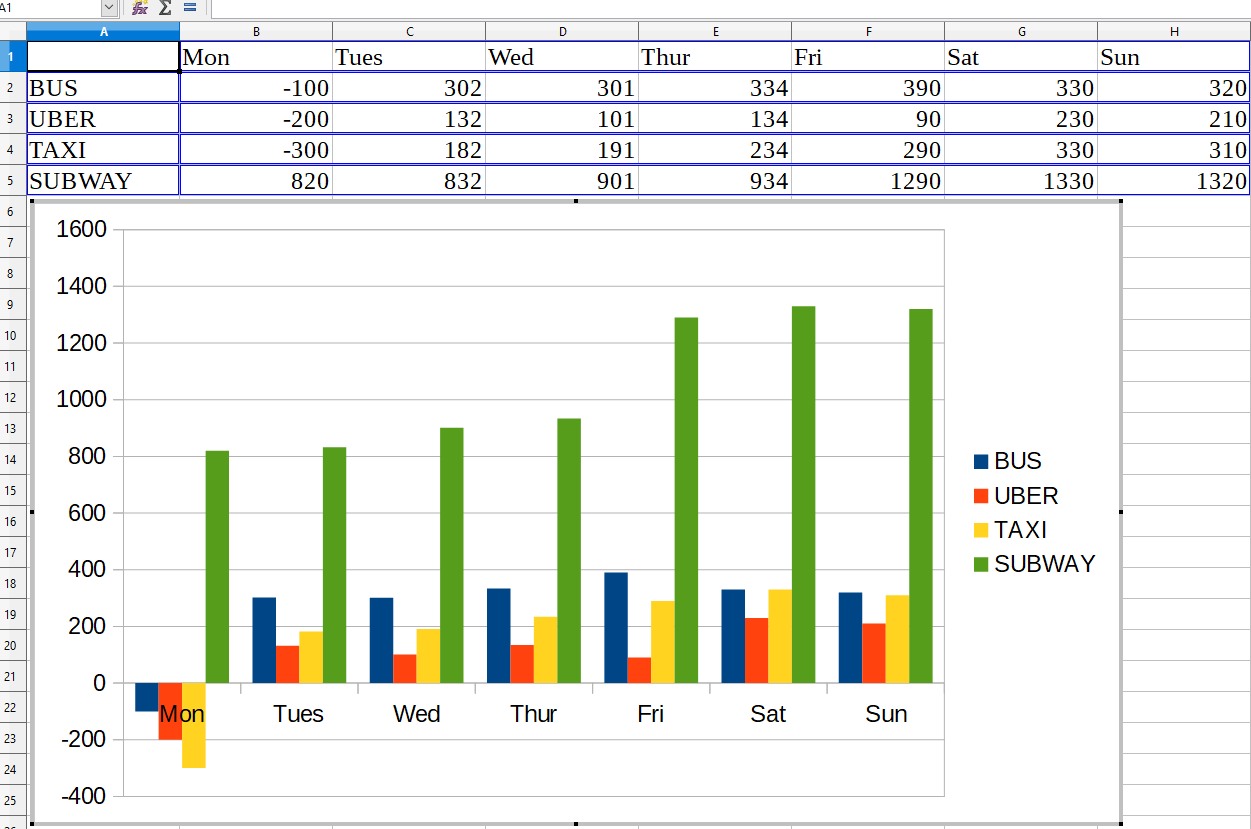
    And X Axis labels for a column chart when there are negative values - the labels need to be lowered rather than stay near the axis. See attached screen shot.

    Andrew Woods

  • Posted 20 April 2018, 10:50 am EST

    Hello,

    This feature is currently not supported.

    I have submitted this to development team for further consideration. This may get added to the future build of SoreadJS. The request id for this is 257359

    Thanks,

    Deepak sharma

  • Posted 22 October 2018, 3:27 am EST - Updated 3 October 2022, 11:05 am EST

    I ran into the same problem with negative values over the labels

    You should move the labels to the front:

  • Posted 23 October 2018, 4:35 am EST

    Hello,

    This functionality has already been added to our product backlog for future version of SpreadJS.

    We currently have not ETA for this, sorry for the inconvenience.

    Thanks,

    Deepak Sharma

Need extra support?

Upgrade your support plan and get personal unlimited phone support with our customer engagement team

Learn More

Forum Channels