Posted 2 August 2024, 3:47 pm EST - Updated 2 August 2024, 3:52 pm EST
I want to set the style of my pivot table value fields. The documentation(https://developer.mescius.com/spreadjs/docs/features/pivot-table/themes-and-style) describes how to set the style of column fields and row fields, but not value fields.
Here is some sample code:
       this.spread.addSheet(1)
       var sourceSheet = this.spread.getSheet(0)
       var sheet = this.spread.getSheet(1)

       var sourceData = [["Date","Buyer","Type","Amount", "Amount2"],
                         ["01-Jan","Mom","Fuel",74, 47],
                         ["15-Jan","Mom","Food",235, 532],
                         ["17-Jan","Dad","Sports",20, 2],
                         ["21-Jan","Kelly","Books",125, 521]]
       sourceSheet.setArray(0, 0, sourceData)
       sourceSheet.tables.add('sourceData', 0, 0, 5, 5)
       var layout = GC.Spread.Pivot.PivotTableLayoutType.tabular
       var theme = GC.Spread.Pivot.PivotTableThemes.medium2
       var options = {showRowHeader: true, showColumnHeader: true}
       var pivotTable = sheet.pivotTables.add("pivotTable1", 'sourceData', 1, 1, layout, theme, options)
       pivotTable.add("Buyer", "Buyer", GC.Spread.Pivot.PivotTableFieldType.rowField)
       pivotTable.add("Type", "Type", GC.Spread.Pivot.PivotTableFieldType.rowField)
       pivotTable.add("Amount", "Amount", GC.Spread.Pivot.PivotTableFieldType.valueField, GC.Pivot.SubtotalType.sum)
       pivotTable.add("Amount2", "Amount2", GC.Spread.Pivot.PivotTableFieldType.valueField, GC.Pivot.SubtotalType.sum)
       let style = new GC.Spread.Sheets.Style()
       style.backColor = "#03A685"
       let area: GC.Spread.Pivot.IPivotArea = {
         fieldName: 'Amount',
       }
       pivotTable.setStyle(area, style)
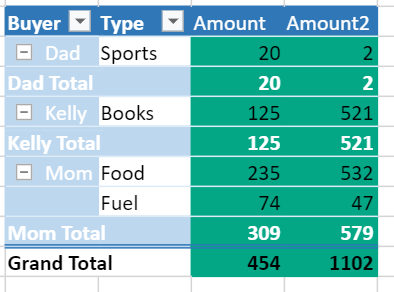
However, the resulting behavior is that both value fields are highlighted (see attached image). I don’t seem to have any granular control over the styles of individual value fields. I’ve tried just about everything I can think of in terms of modifying the definition of the pivotArea, but nothing seems to work.


