Posted 12 June 2024, 3:20 pm EST - Updated 12 June 2024, 3:25 pm EST
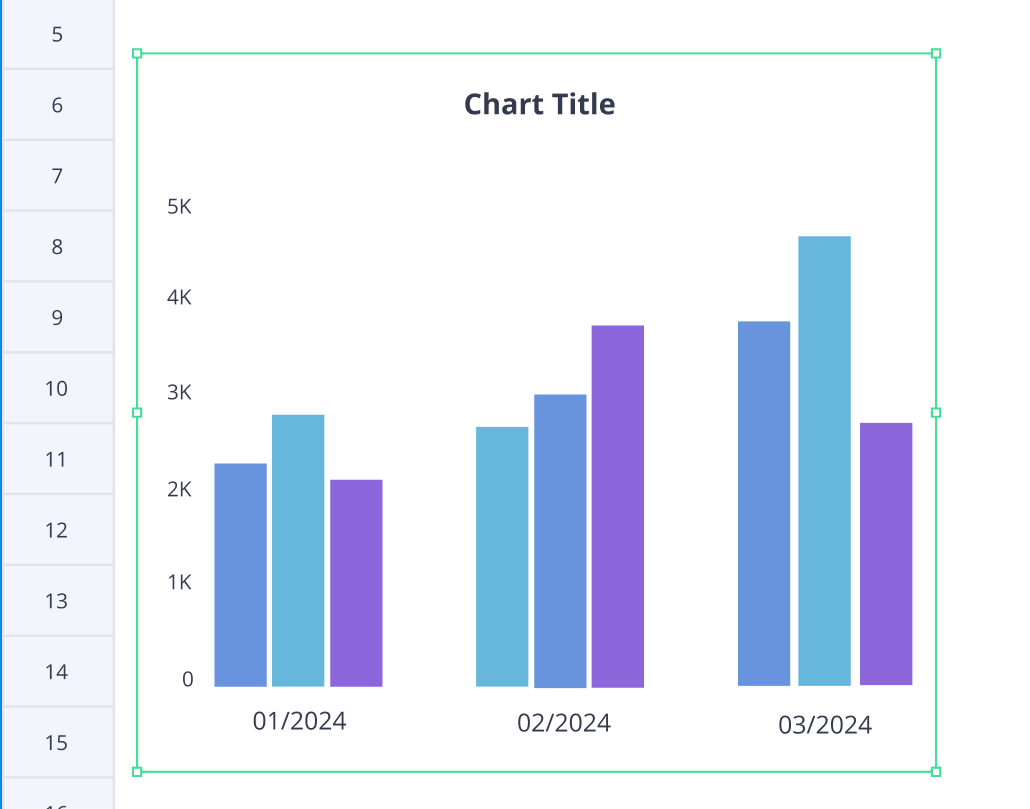
Custom border of chart
Posted by: ricardo.aleixo on 12 June 2024, 3:20 pm EST
-
-
Posted 13 June 2024, 4:41 am EST
Hi,
Yes, you can change the border color of the chart. Please refer to the attached snippet and demo for guidance.
var chartArea = chart.chartArea();

    chartArea.border.color = "green";
    chartArea.border.width = 3;
    chart.chartArea(chartArea);
Demo: https://developer.mescius.com/spreadjs/demos/features/charts/customization/chart-area/purejs
Refer to this article to know more about border customization of chart: https://developer.mescius.com/spreadjs/docs/features/Charts/ConfigureChartElements/chart-area#customize-chart-area-border
Regards,
Priyam


