Create a chart from a table

Posted by: Fabrice.Mainguene on 31 May 2022, 12:15 pm EST

    • Post Options:
    • Link

    Posted 31 May 2022, 12:15 pm EST - Updated 3 October 2022, 9:15 am EST

    Hi,

    when I try to create a chart from a table I obtain:


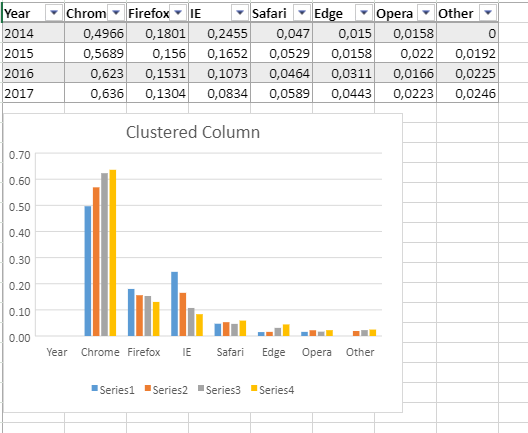
    The first column of the table is used as data and not as title for the legend.

    Is there a way to use the first column to fill the series names?

  • Posted 1 June 2022, 8:03 am EST

    Hi,

    We are sorry but this is expected if the first column is the legends the first cell(in your case it is Year) should be empty Excel also does the same. Further, you may also add the x values by API. Please refer to the following demos that explain how you could customize the series.

    customize series demo: https://www.grapecity.com/spreadjs/demos/features/charts/customization/series/purejs

    Regards,

    Avinash

Need extra support?

Upgrade your support plan and get personal unlimited phone support with our customer engagement team

Learn More

Forum Channels