Add animation for new chart added

Posted by: trankhanhngan00 on 4 October 2024, 12:35 am EST

    • Post Options:
    • Link

    Posted 4 October 2024, 12:35 am EST

    Hi team,

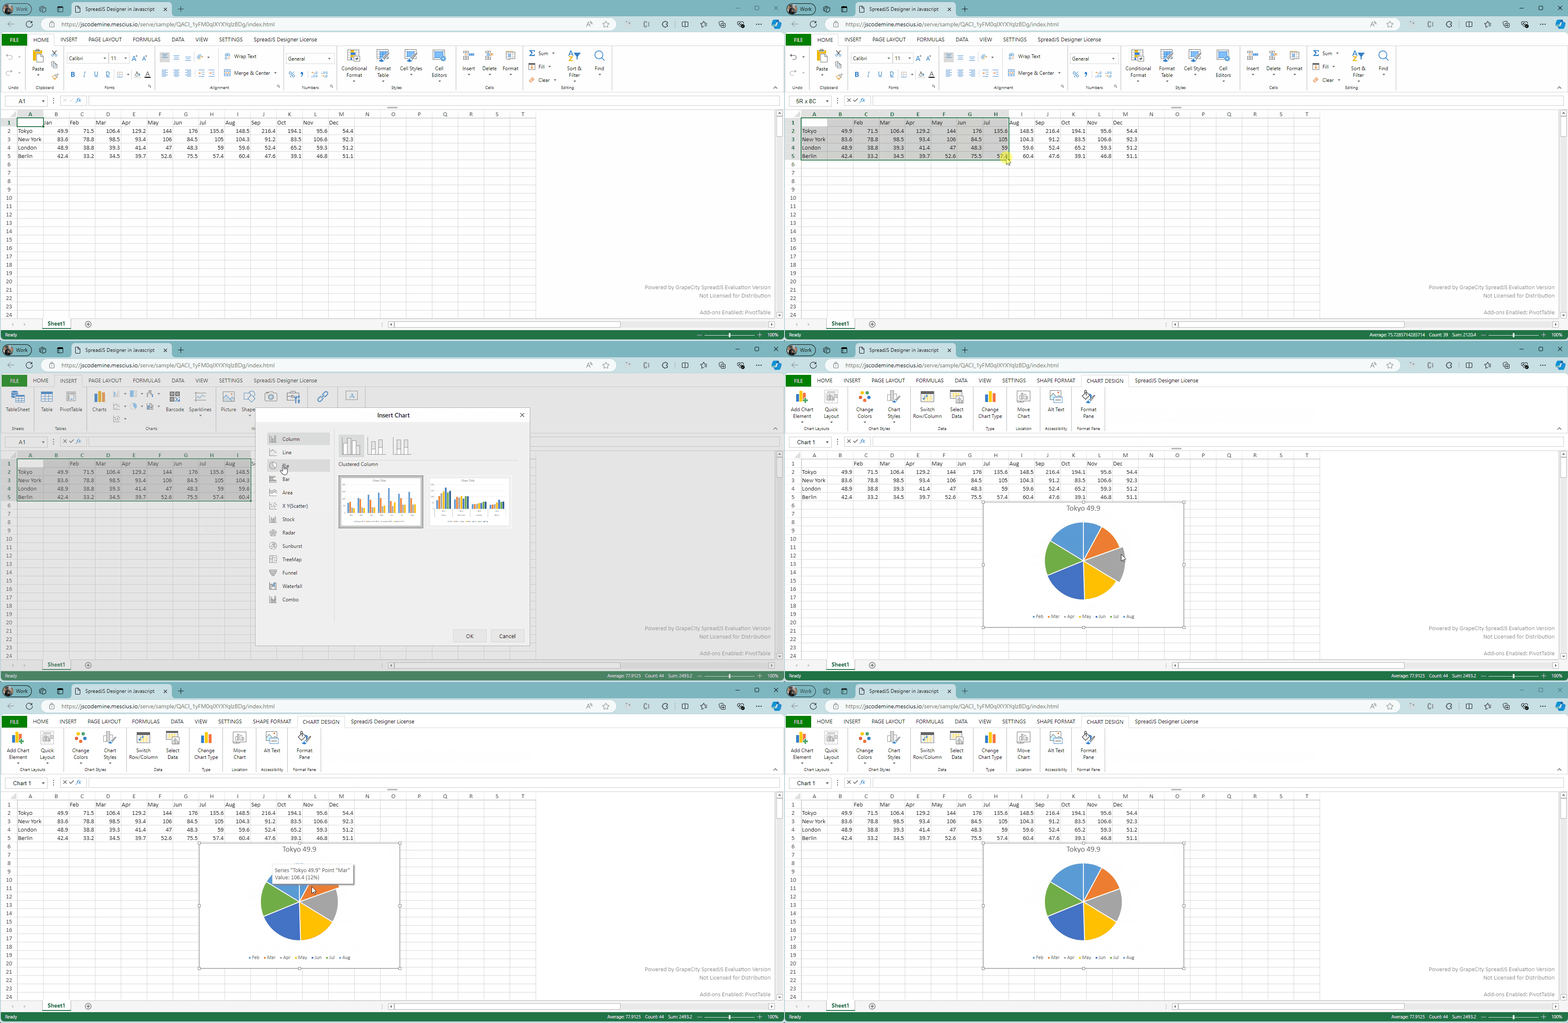
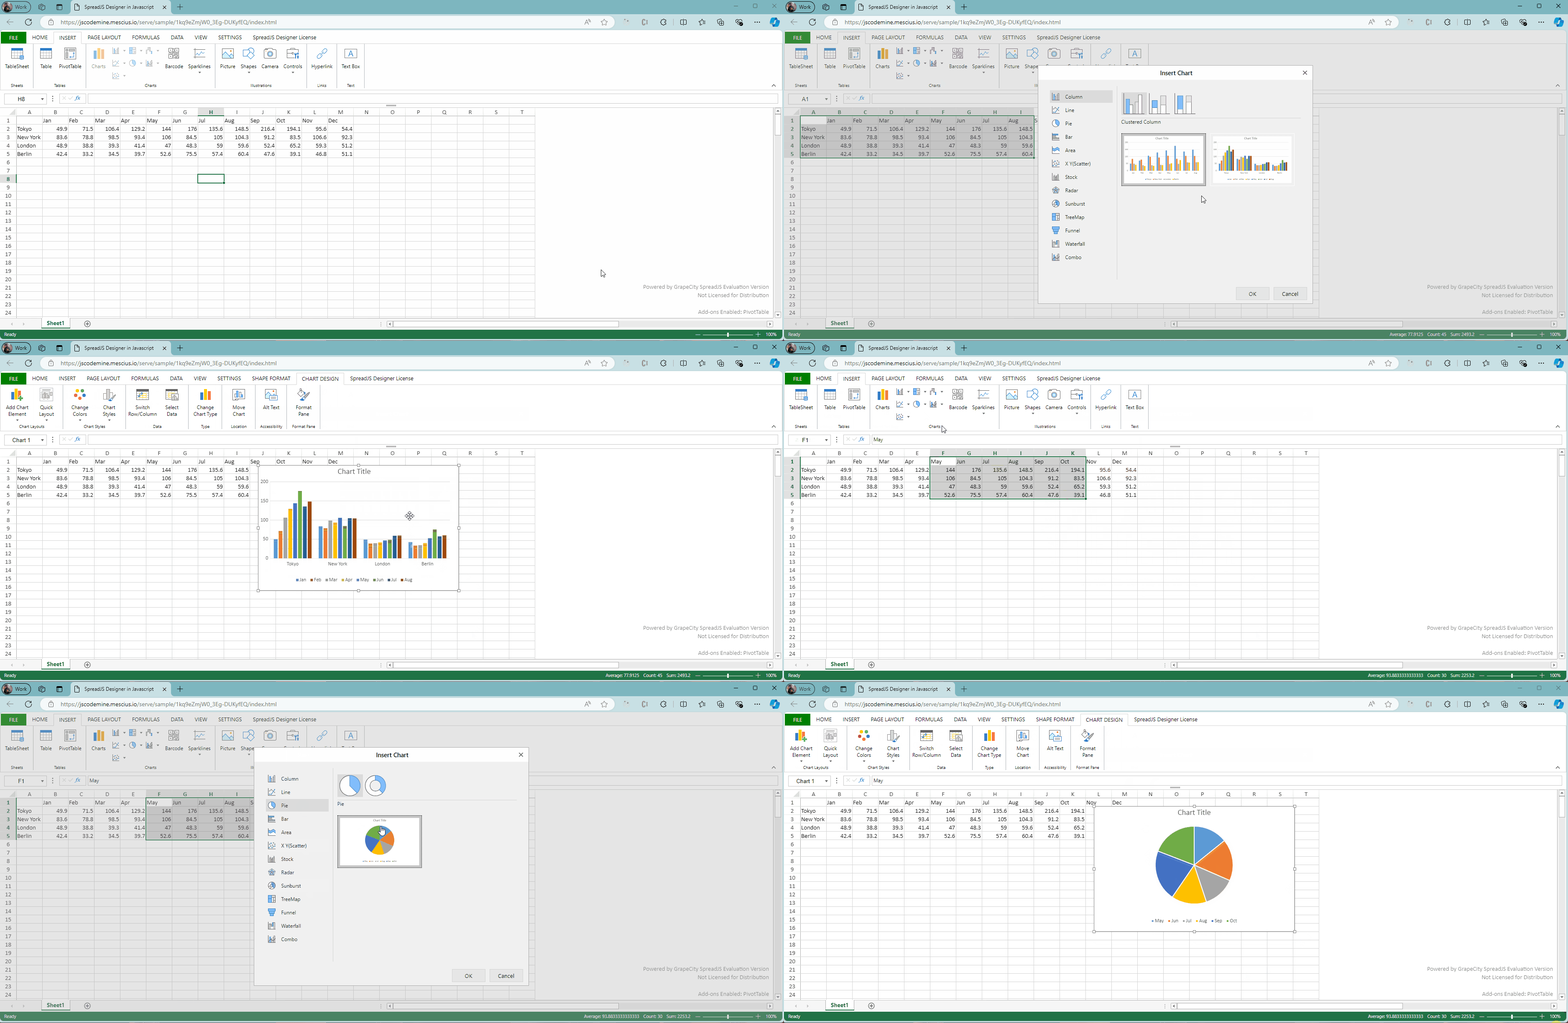
    Is there any way to add animation for new chart added? I want them to apprear with animation

    This is my code, but it doesn’t work:

    const commandManager = spread.commandManager();
    commandManager.addListener('appListener', (args) => {
        if (args.command.cmd === "Designer.insertChart") {
    	let charts = spread.getActiveSheet().charts.all() || [];
            charts.forEach(chart => {
                chart.useAnimation(true);
            });
        }
    });

    Could you suggest me a solution to handle this?

    Thank you!

  • Posted 4 October 2024, 2:18 am EST - Updated 4 October 2024, 2:24 am EST

    Hi,

    I tested with the provided code snippet and it works fine at my end. You could refer to the following sample that I have tested with.

    Sample: https://jscodemine.mescius.io/share/iGuqONZjm0u0SZ4ndctBSQ/?defaultOpen={"OpenedFileName"%3A["%2Fsrc%2Fapp.js"]%2C"ActiveFile"%3A"%2Fsrc%2Fapp.js"}

    Could you kindly share the sample for which you are facing the issue? You could also modify the above sample and share it with us replicating the issue.

    You could refer to the following docs regarding the Animation In Chart: https://developer.mescius.com/spreadjs/docs/features/Charts/UsingAnimationInCharts

    Please note that the SpreadJS supports animation only in four types of charts - Column chart, Bar chart, Line chart and Pie chart as mentioned in the above docs.

    Regards,

    Ankit

  • Posted 4 October 2024, 2:52 am EST - Updated 4 October 2024, 2:57 am EST

    Hi Ankit,

    I want to customize current behavior of action inserting chart.

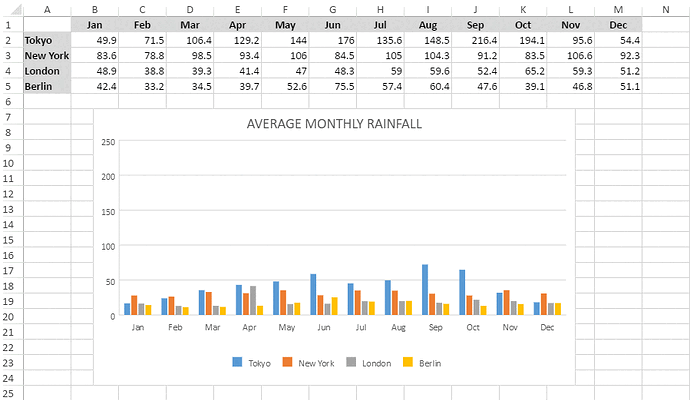
    For example, I want chart will have rising animation like this right after it is inserted into sheet

  • Posted 4 October 2024, 2:54 am EST

    Currently, I am customizing like this:

    export const customStyleSpread = (spread) => {  
      spread.sheets.forEach(sheet => {
        sheet.suspendPaint();
        let charts = sheet.charts.all() || [];
        charts.forEach(chart => {
          chart.useAnimation(true);
        });
        sheet.resumePaint();
      })
    }


    But rising animation just appears when I re-open excel table, but not right after inserting charts

  • Posted 4 October 2024, 6:08 am EST - Updated 4 October 2024, 6:13 am EST

    Hi,

    Currently, it is not supported to add such animation to the charts using the APIs. These kinds of animation automatically happens if you change the data source of the chart data source area, resize the chart, copy pasting in the chart data source area, etc. This behaviour is consistent with the Microsoft Excel.

    In your case, if you want to have such animation, as a workaround you could simply resize the chart after it is being added. Refer to the following code snippet:

    const commandManager = spread.commandManager();
    commandManager.addListener('appListener', (args) => {
        if (args.command.cmd === "Designer.insertChart") {
            let charts = spread.getActiveSheet().charts.all() || [];
            charts.forEach(chart => {
                chart.useAnimation(true);
                const oldHeight = chart.height();
                chart.height(oldHeight + 30);
                setTimeout(() => {
                    chart.height(oldHeight)
                }, 200)
            });
        }
    });

    Sample: https://jscodemine.mescius.io/share/4UonPqAPRUCQcHq80hllDw/?defaultOpen={"OpenedFileName"%3A["%2Fsrc%2Fapp.js"]%2C"ActiveFile"%3A"%2Fsrc%2Fapp.js"}

    height method: https://developer.mescius.com/spreadjs/api/classes/GC.Spread.Sheets.Charts.Chart#height

    Regards,

    Ankit

Need extra support?

Upgrade your support plan and get personal unlimited phone support with our customer engagement team

Learn More

Forum Channels