Posted 17 March 2020, 6:01 pm EST - Updated 3 October 2022, 10:26 am EST
Add a chart using ReactJS
Posted by: jerome on 17 March 2020, 6:01 pm EST
-

jerome
-

sharad.tomer

Posted 18 March 2020, 1:16 am EST
Hi Jerome,
For adding charts support, we need to add the “@grapecity/spread-sheets-charts” package to our application too. Please refer to the following sample and let us know if you face any issues:
https://codesandbox.io/s/interesting-morse-d3qdkRegards
Sharad -
jerome
Posted 18 March 2020, 3:51 pm EST
got it thanks i try this one first
-
sharad.tomer
Posted 19 March 2020, 4:53 am EST
Hi Jerome,
Have you imported the charts module in your component like the following code snippet:
import * as GC from "@grapecity/spread-sheets";
import "@grapecity/spread-sheets-charts";
If yes, please share a sample that replicates the issue so that we could further investigate it and assist you accordingly.
-
jerome
Posted 19 March 2020, 5:55 am EST - Updated 3 October 2022, 10:27 am EST
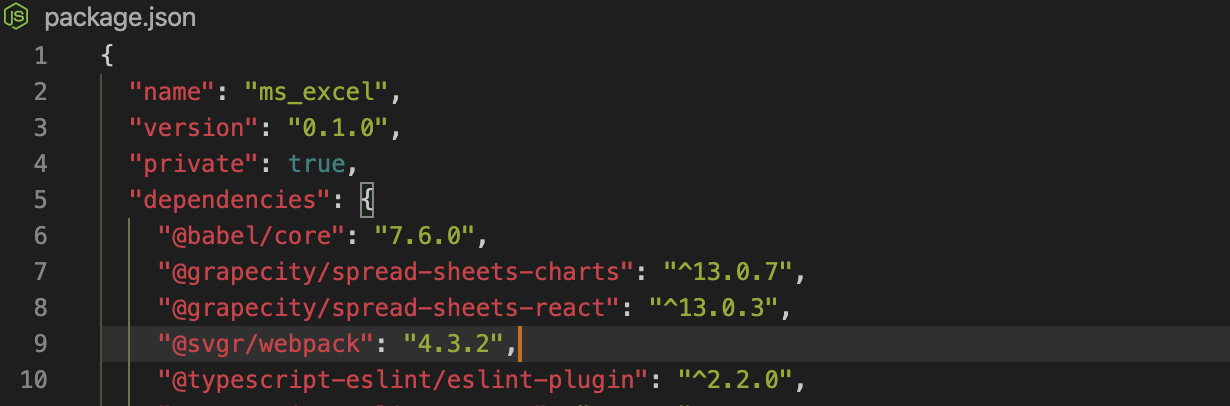
hello tomer, yes i import that already, first i install that via yarn ,
yarn add @grapecity/spread-sheets-charts and it add on the package.json
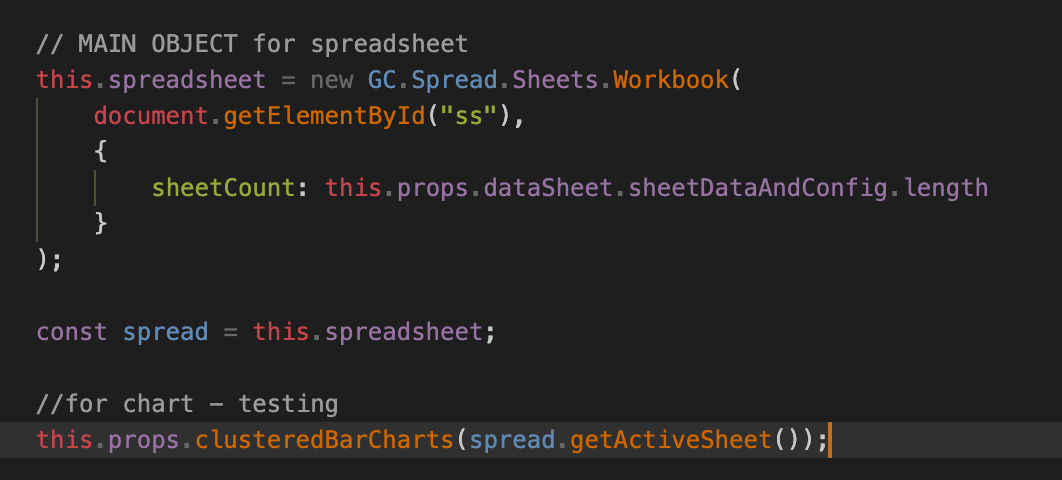
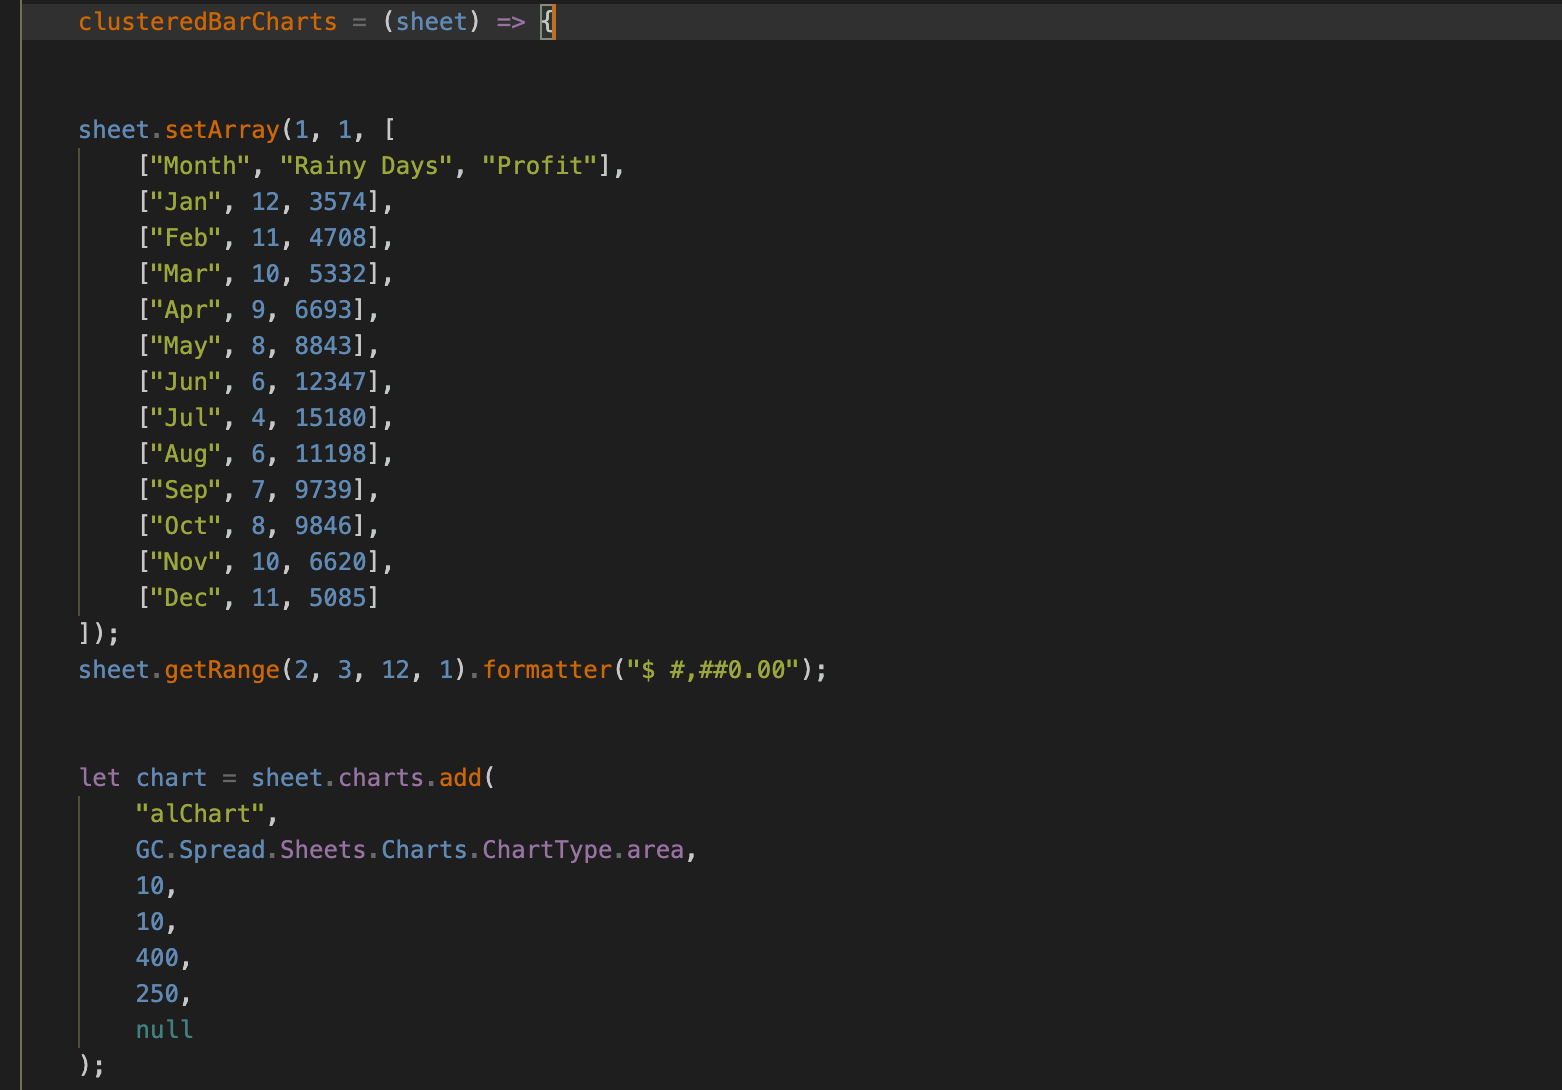
,then i create a separate file for that spreadsheet,
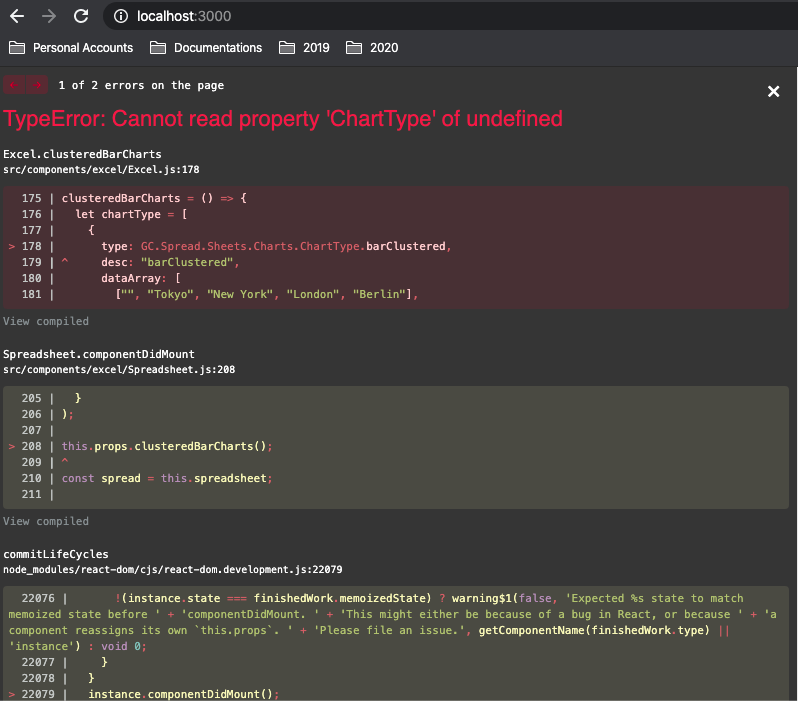
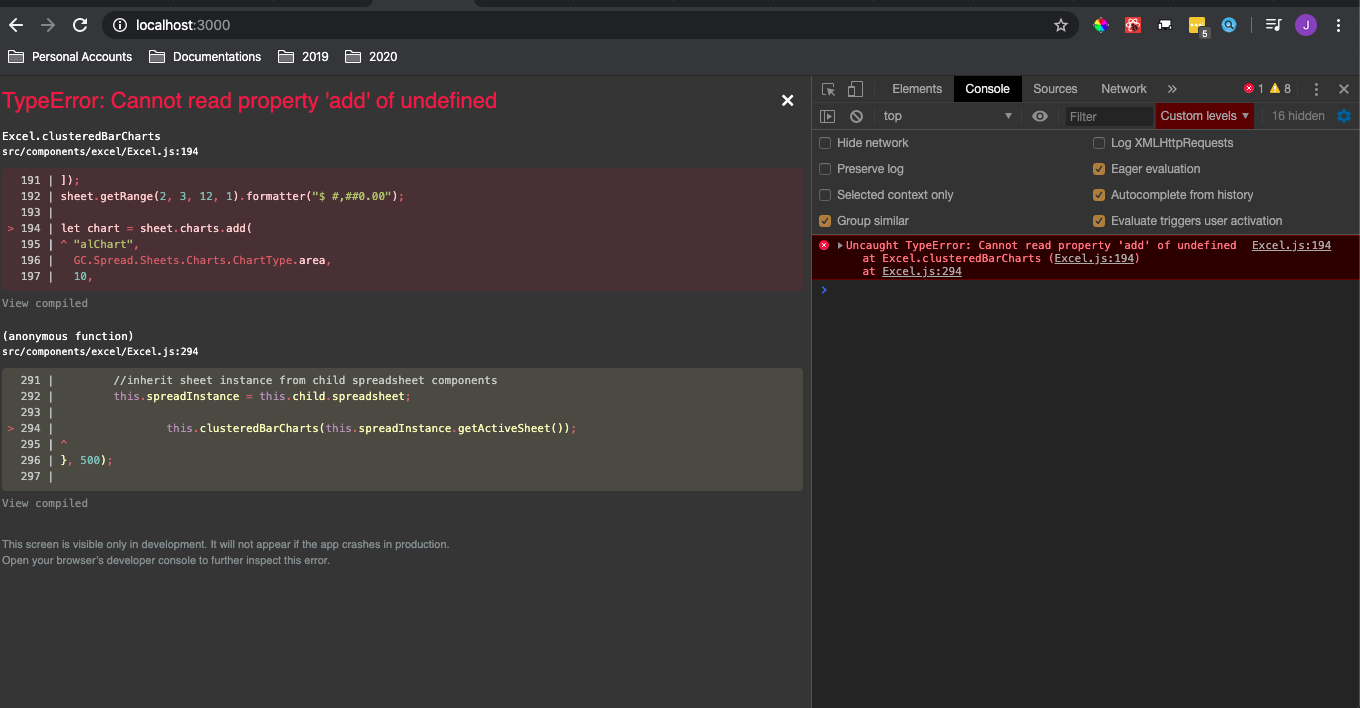
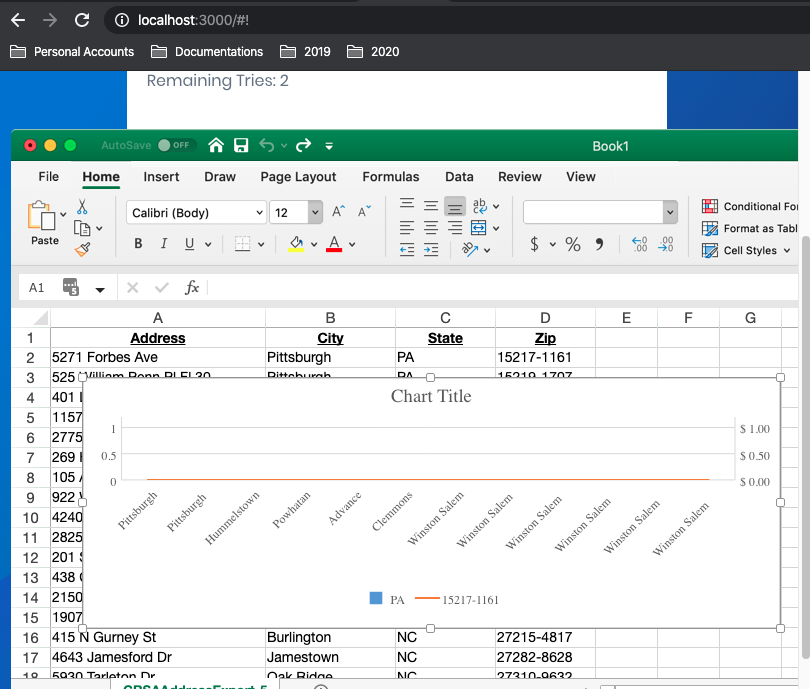
and call that clusteredBarCharts function for testing to render a sample chart
then this error i encountered
-
sharad.tomer
Posted 20 March 2020, 1:18 am EST
In the shared screenshot, the version of the @grapecity/spread-sheets-react used is 13.0.3 whereas the version used for @grapecity/spread-sheets-charts package is 13.0.7. Please make sure that you are using the same version of both the packages.