Posted 12 February 2019, 3:25 am EST - Updated 30 September 2022, 5:51 pm EST
Hi team ,
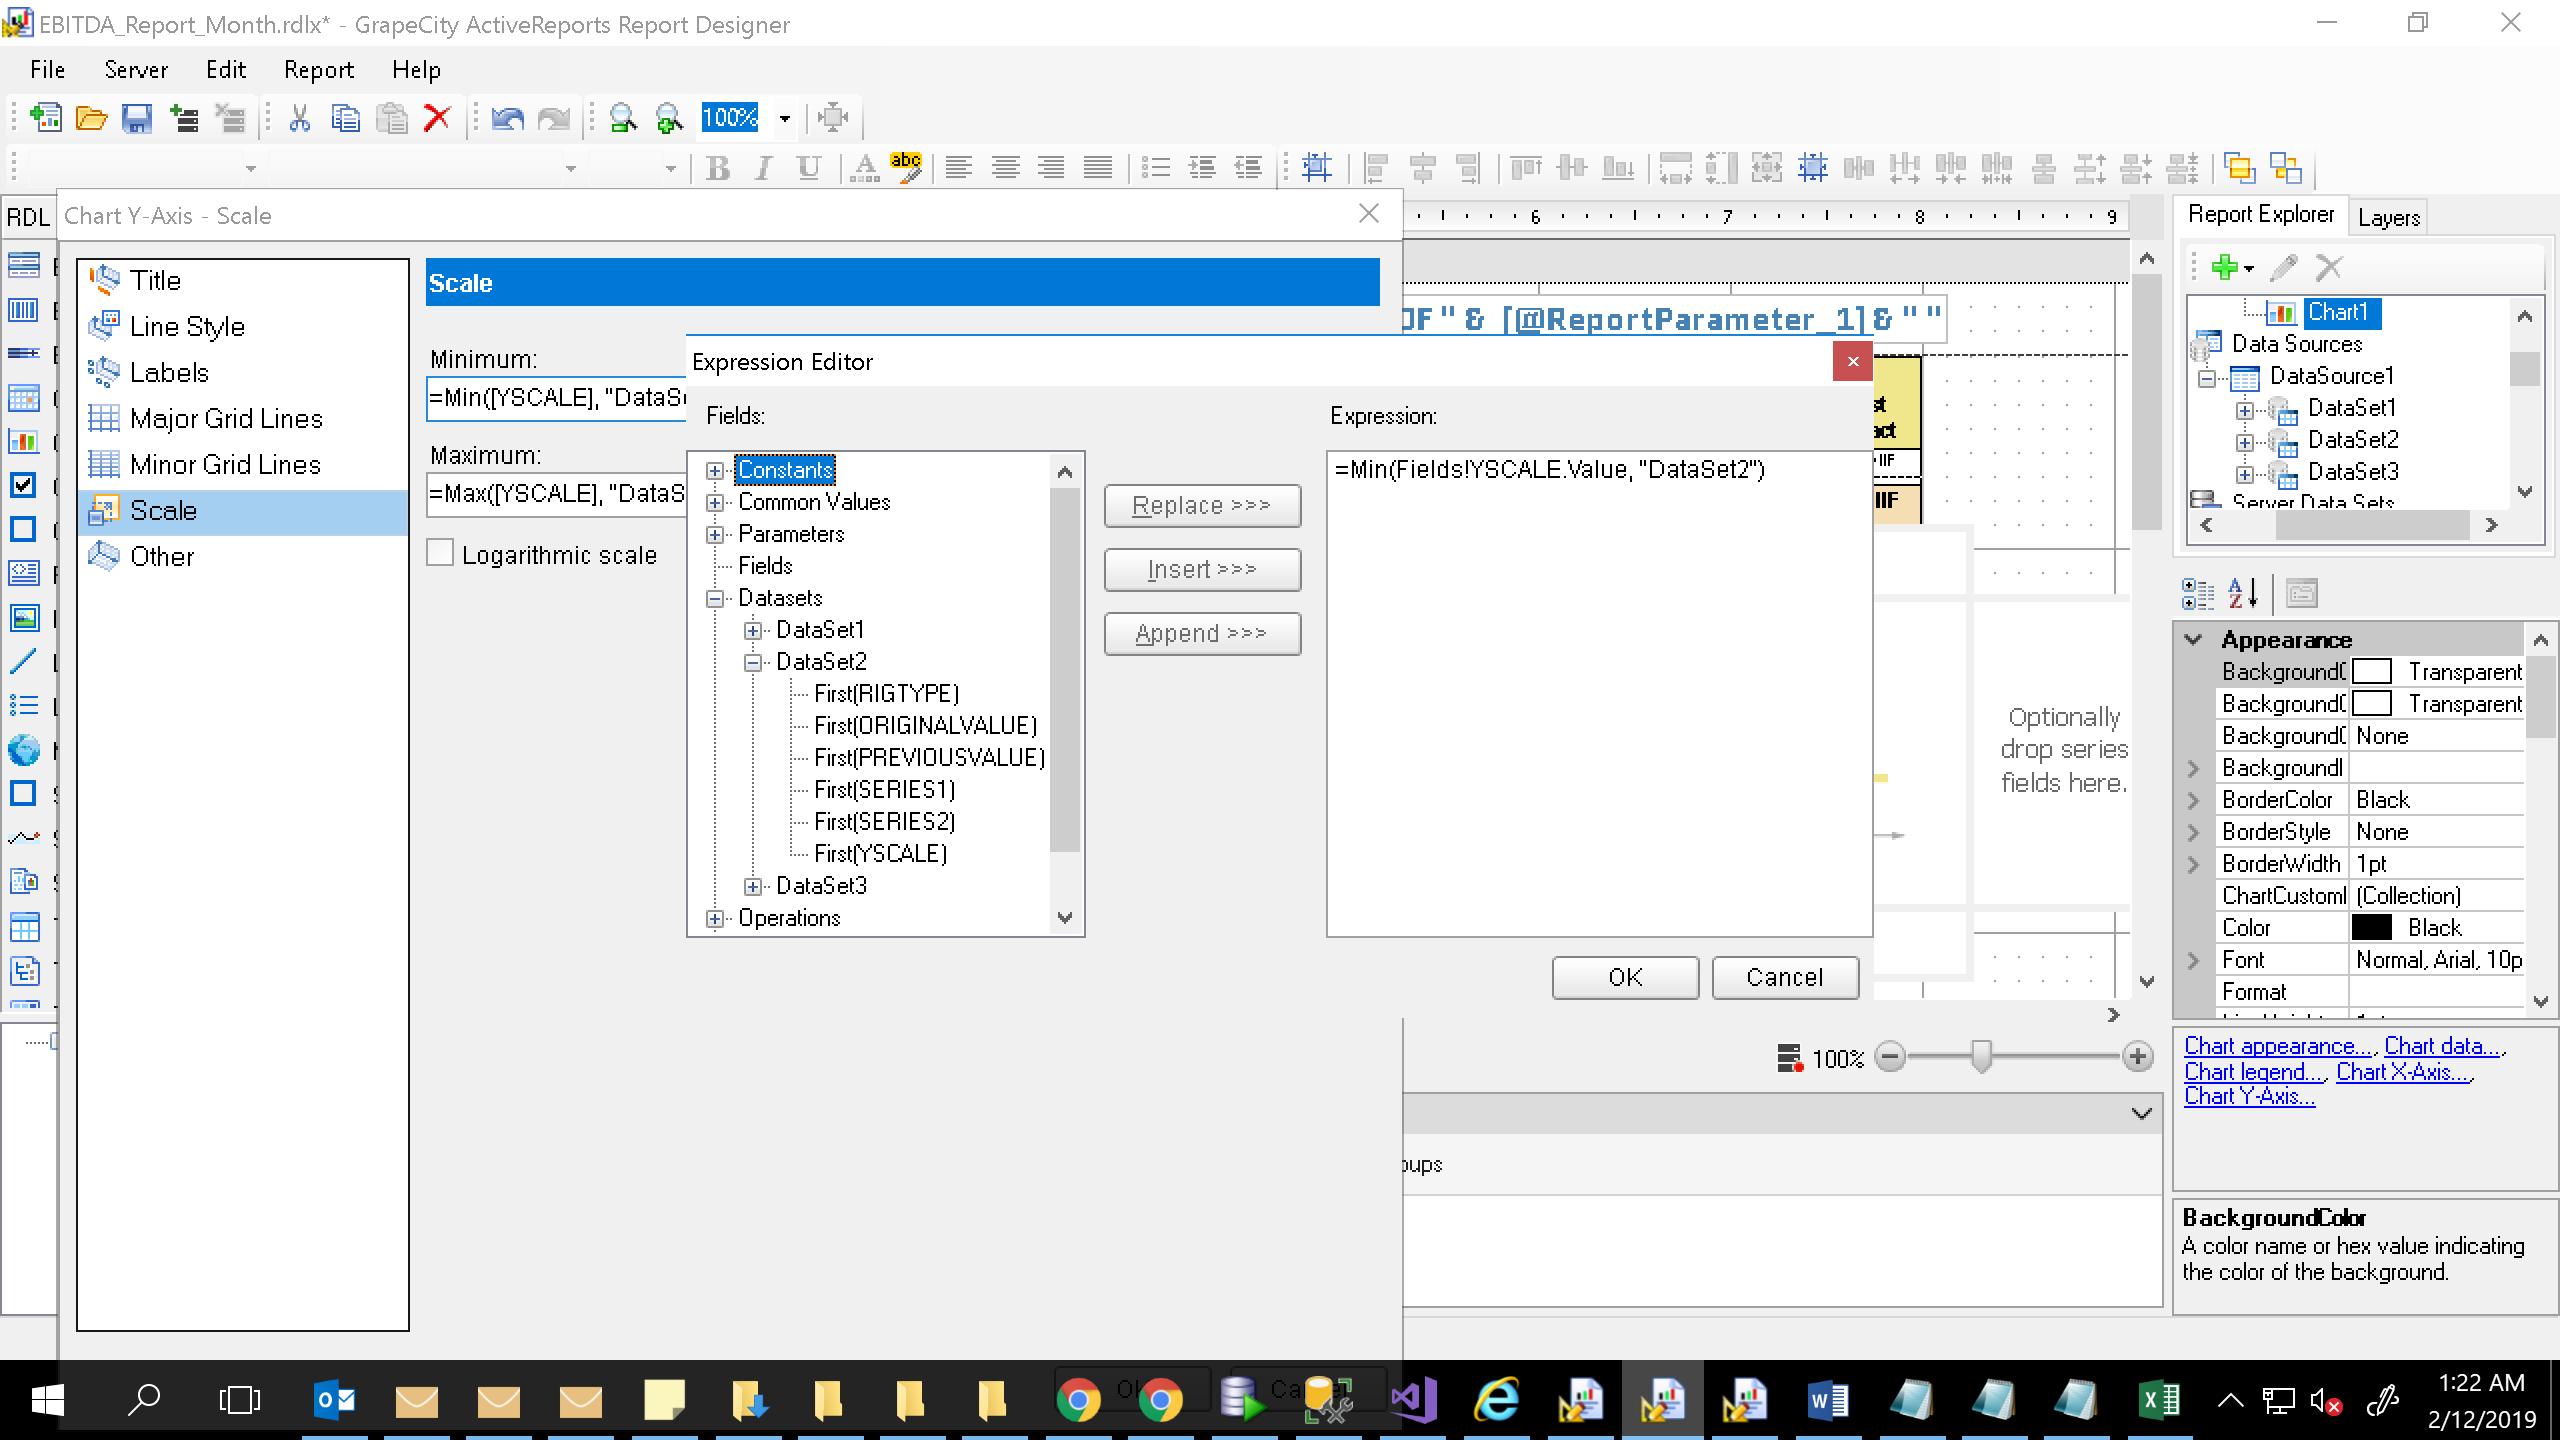
we are facing issue to set the Y axis scale based on the data . Irrespective of data , scale is getting defined with different values. Not sure what is the reason .
Please find the attached report with mock data .
Another issue with our report is that , in the properties we are not getting fields defined as data set properties . PFA screenshot for reference . In our rdl report , we have a tablix(dataset1) and a chart (dataset2). Chart is drawn correctly but facing issue with scale set up