AR 13 3D Line Chart

Posted by: dlipsy on 13 April 2020, 11:42 am EST

    • Post Options:
    • Link

    Posted 13 April 2020, 11:42 am EST - Updated 30 September 2022, 5:15 pm EST

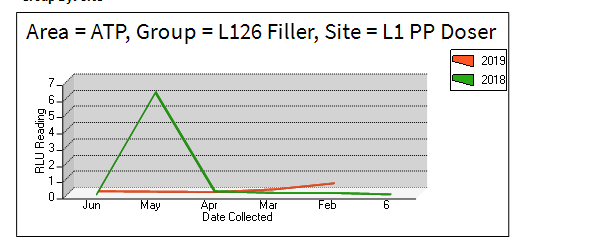
    When I’m trying to get 3D line chart to work, I’m hitting an issue where a single point doesn’t show up in the chart at all. Sometimes, I have data for only one month in the year and need to show a larger dot for that series. How might I update/change my series type in that situation? Currently, I have this in place…

    
                            series.Add(new Series() { Name = seriesName, Type = ChartType.Line3D, LegendText = yearVal.ToString() });
    
                        series[seriesName].Points.Add(new DataPoint([Translated Month in Year], new DoubleArray(new double[] { readingValue }), false));


  • Posted 14 April 2020, 10:19 am EST

    Hello,

    You can use the following code in Detail format event to change the type at runtime:

    private void detail_Format(object sender, EventArgs e)

    {

    if(this.chartControl1.Series[0].Points.Count==1)

    this.chartControl1.Series[0].Type = ChartType.Bar3D;

    }

    Hope it helps.

    Thanks,

    Mohit

  • Posted 14 April 2020, 10:37 am EST

    Thank you, that helps.

    I have this:

      
    foreach (Series currseries in rluChartControl.Series)
    {
    if (currseries.Points.Count == 1)
    	currseries.Type = ChartType.Bar3D;
    }


    However, I don’t want a bar chart. How do I get a line chart with a point in 3D-space?

  • Posted 15 April 2020, 10:13 am EST - Updated 30 September 2022, 5:15 pm EST

    Well, I did find a workaround and set the other date values to 0. However, when I try to create my series/legends from scratch, I keep getting the default line color bleeding through as LineBackdrop (or some other property). How do I remove that color from my series line?

    
                            series.Add(
                                new Series()
                                {
                                    Name = seriesName,
                                    Type = ChartType.Line3D,
                                    LegendText = yearVal.ToString(),
                                    Properties = new CustomProperties(new KeyValuePair[] { new KeyValuePair("BorderLine", new Line(currColor)), new KeyValuePair("LineBackdrop", Color.Black) }),
                                    LegendItemsMode = LegendMode.Series
                                });
    

    Image attached.

  • Posted 15 April 2020, 1:29 pm EST

    Hello,

    Please try to remove the following property:

                                Properties = new CustomProperties(new KeyValuePair[] { new KeyValuePair("BorderLine", new Line(currColor)), new KeyValuePair("LineBackdrop", Color.Black) }),
    

    Thanks,

    Mohit

  • Posted 15 April 2020, 1:34 pm EST

    No, I need that custom property to set the line color properly, since I don’t want to use the default colors. The borderline color is correct, but the backdrop color is something different than what I tried to specify as LineBackdrop.

  • Posted 15 April 2020, 2:12 pm EST

    If you want to set the different series color then you can use the folllowing lines of code instead of using the custom property.

    GrapeCity.ActiveReports.Chart.Graphics.Backdrop bd = new GrapeCity.ActiveReports.Chart.Graphics.Backdrop();
                bd.Color = Color.Blue;
                arChartSeries.Backdrop = bd;


    Or you can try after setting the Backdrop to transparent also.

  • Posted 15 April 2020, 4:04 pm EST

    None of that seems to help: I tried this but no help…

    
     series.Add(
                                new Series()
                                {
                                    Name = seriesName,
                                    Type = ChartType.Line3D,
                                    Backdrop = new Backdrop(Color.Transparent),
                                    BorderLine = new Line(currColor),
                                    LegendText = yearVal.ToString(),
                                    LegendItemsMode = LegendMode.Series
                                });
    
    
  • Posted 15 April 2020, 4:04 pm EST - Updated 30 September 2022, 5:15 pm EST

  • Posted 16 April 2020, 10:48 am EST

    Hello,

    Please use the following line to change the color of line and border:

    arChartSeries.Properties = new GrapeCity.ActiveReports.Chart.CustomProperties(new GrapeCity.ActiveReports.Chart.KeyValuePair { new GrapeCity.ActiveReports.Chart.KeyValuePair(“BorderLine”, new Line(Color.Blue)), new GrapeCity.ActiveReports.Chart.KeyValuePair(“LineBackdrop”, Color.Black) });

    Thanks,

    Mohit

  • Posted 16 April 2020, 10:50 am EST

    You know, that is what I did here, but it didn’t help:

    https://www.grapecity.com/forums/ar-dev/ar-13-3d-line-chart-#well-i-did-find-a-workarou

  • Posted 16 April 2020, 11:13 am EST

    Hello,

    Sorry for the confusion:

    Try this:

    arChartSeries.Properties = new CustomProperties(new KeyValuePair { new KeyValuePair(“BorderLine”, new Line(Color.Red)), new KeyValuePair(“LineBackdrop”, new Backdrop(Color.Purple)) });

    Thanks,

    Mohit

Need extra support?

Upgrade your support plan and get personal unlimited phone support with our customer engagement team

Learn More

Forum Channels