Posted 10 September 2018, 11:00 am EST - Updated 30 September 2022, 3:54 pm EST
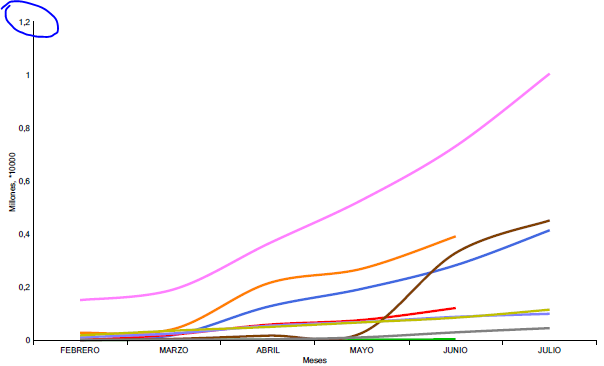
Report Chart - How to change the scale of the Y axis
Posted by: adrianayala on 10 September 2018, 11:00 am EST
-
-
Posted 11 September 2018, 6:16 am EST
Hi,
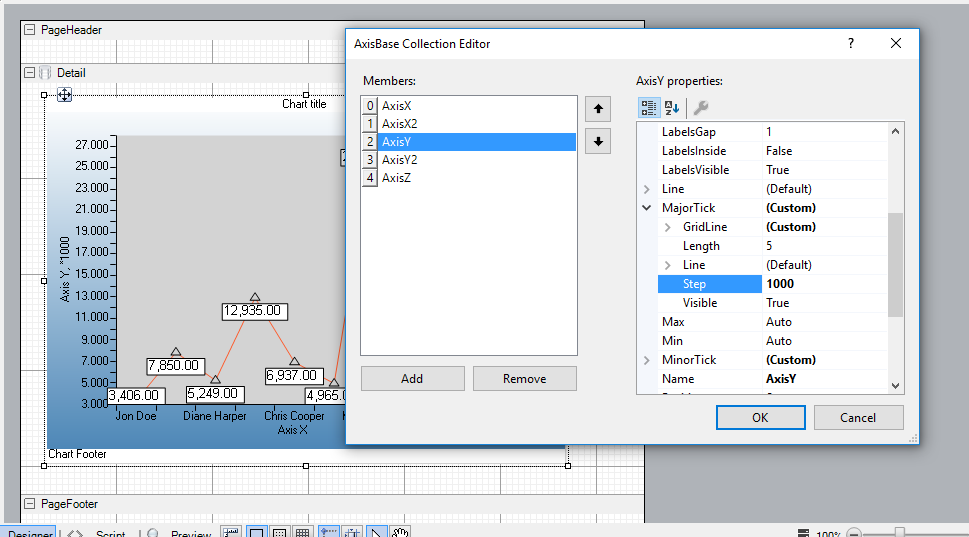
You can set the Step property to 1000 of the Y Axis to achieve the desired result. Please see attached screen shot.
-
Posted 11 September 2018, 9:09 am EST - Updated 30 September 2022, 3:55 pm EST
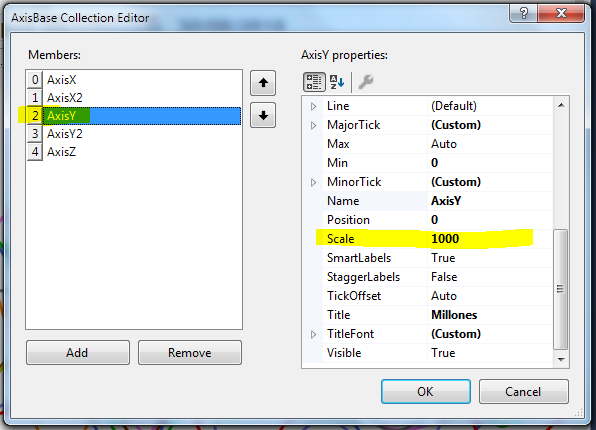
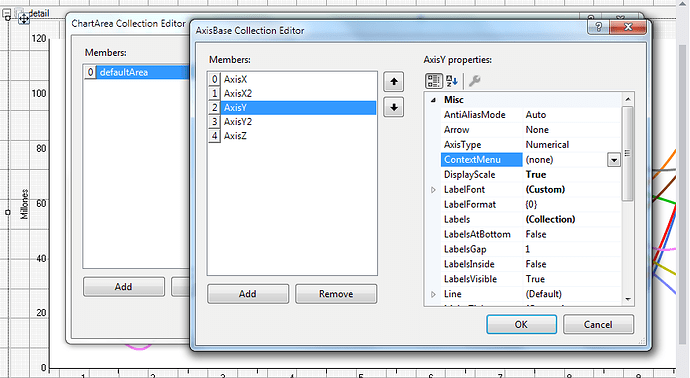
Hello Michael, thank for help me!, I has Send screen shot for properties chart to Axis Y

-
Posted 15 September 2018, 6:11 pm EST
I was also getting the same issue with the X-axis, and the given answer for that really helped me. The step which has been shown here for the rescaling the Y-axis. I was doing a project for the https://babasupport.org/dell/dell-bios-update/ and have to make the graph.


