Negative Percentage in chart

Posted by: bnguyen on 29 January 2024, 7:19 am EST

    • Post Options:
    • Link

    Posted 29 January 2024, 7:19 am EST - Updated 29 January 2024, 7:37 am EST

    Report Type: RDL

    Chart Type: Column

    Hi

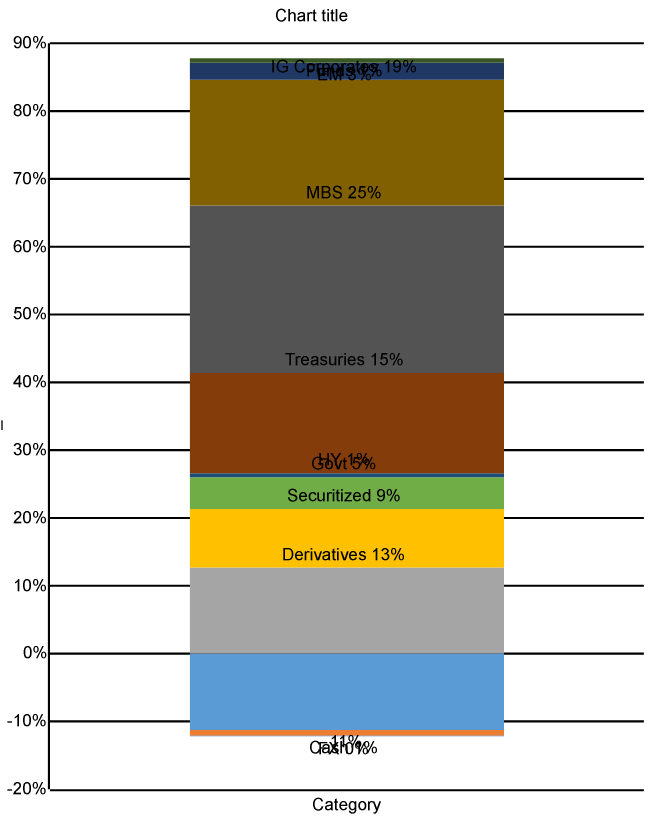
    How do you set Y percentages in charts to minimum percentage to maximum percentage value? I have both positive and negative values in my table. It looks like the negative values are being treated as positive values, resulting in incorrect percentages as well.

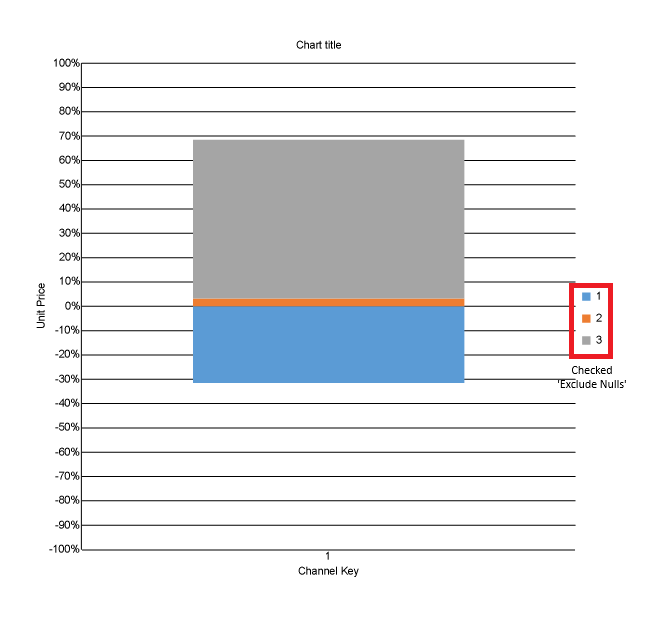
    Also, I have set a filter to filter out null values, however, the nulls are still present. I have also checked the exclude nulls checkbox. How do we remove this from the aggregate?

  • Posted 29 January 2024, 5:35 pm EST - Updated 29 January 2024, 5:40 pm EST

    Hi Bryan,

    The negative percentage values seem to work as expected i.e. the negative values are being treated as negative values, resulting in the bar going below 0% in the stacked chart.

    If you want to specify a ‘Min’ or ‘Max’ value to your percentage axis, you can select your Y-axis and set ‘Min’ to ‘-1’ for ‘-100%’ and ‘1’ for ‘100%’.

    For filtering our null values the ‘Exclude Nulls’ also seems to work as expected, please refer to our attached image when keeping ‘Exclude Nulls’ unchecked, and when checking the checkbox for ‘Exclude Nulls’ the Legend shows a ‘Null’ legend and no legend for null values respectively.

    Unchecked ‘Exclude Nulls’

    Checked ‘Exclude Nulls’

    Please find attached our sample implementing the same for your reference.

    Regards,

    Anand

    Sample: StackedColumnChart.zip

Need extra support?

Upgrade your support plan and get personal unlimited phone support with our customer engagement team

Learn More

Forum Channels