- FlexGrid for WPF Overview
- Feature Comparison
- Quick Start
- Object Model Summary
- Data Binding
-
Features
- Columns
- Row
- Scrolling Modes
- Selection
- Sorting
- Cell Merging
- Custom Editors
- Custom Icon
- Transpose Data in Grid
- Data Grouping
- Data Filtering
- Data Aggregation
- Custom Cells
- Virtualization
- Paging
- TreeGrid
- Print Support
- Row Details Template
- Layout and Appearance: ClearStyle Technology
- Freezing and Pinning
- Import Data from Excel
- Export to Excel
- Clipboard Operations
- Validation
- FlexGrid Samples
Data Aggregation
FlexGrid lets you compute and display aggregate value for each group created after grouping data. The control shows groups in a collapsible outline format and automatically displays the number of items in each group. However, you can go one step further and display aggregate values for every grouped column. This feature enables users in drawing out more insights from random data.
In the following section learn how to implement Data Aggregation in FlexGrid .NET and .NET Framework versions.
.NET Framework
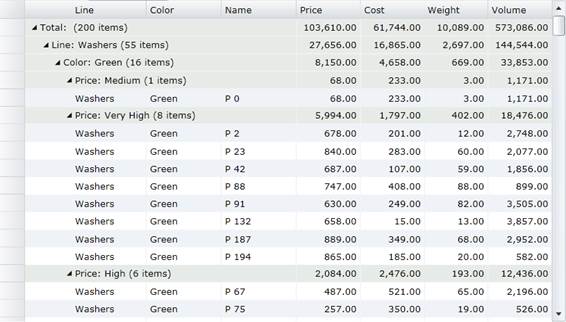
In the below example, a company's sales data grouped by country or product category can be more useful if the aggregate sales can be indicated against each country and product category in the grid itself. The Column class provides the GroupAggregate property that can be set to Aggregate to automatically calculate and display aggregates. The aggregates calculated by setting the GroupAggregate property automatically recalculate the aggregate values when the data changes.
The following image shows a FlexGrid with aggregate values displayed in the columns.

To set aggregate through code
You can display the aggregate value for each group in FlexGrid by setting the grid's AreGroupHeadersFrozen property to false and then setting the GroupAggregate property on each column to one of the supported aggregate values. Some of the supported aggregate values are Sum, Average, Count, Minimum, Maximum, etc.
type=note
Note: Since the aggregates appear in the group header rows, it is necessary to make them visible by setting the AreGroupHeadersFrozen property to false.
The following code illustrates displaying totals for the Price, Cost, Weight and Volume columns through XAML.
<fg:C1FlexGrid x:Name="_flex" AutoGenerateColumns="False"
  AreRowGroupHeadersFrozen="False">
  <fg:C1FlexGrid.Columns>
    <fg:Column Header="Line" Binding="{Binding Line}" />
    <fg:Column Header="Color" Binding="{Binding Color}" />
    <fg:Column Header="Name" Binding="{Binding Name}" />
    <fg:Column Header="Price" Binding="{Binding Price}"
      Format="n2" HorizontalAlignment="Right" Width="*"
      GroupAggregate="Sum"/>
    <fg:Column Header="Cost" Binding="{Binding Cost}"
      Format="n2" HorizontalAlignment="Right" Width="*"
      GroupAggregate="Sum"/>
    <fg:Column Header="Weight" Binding="{Binding Weight}"
      Format="n2" HorizontalAlignment="Right" Width="*"
      GroupAggregate="Sum"/>
    <fg:Column Header="Volume" Binding="{Binding Volume}"
      Format="n2" HorizontalAlignment="Right" Width="*"
      GroupAggregate="Sum"/>
  </fg:C1FlexGrid.Columns>
</fg:C1FlexGrid>
.NET
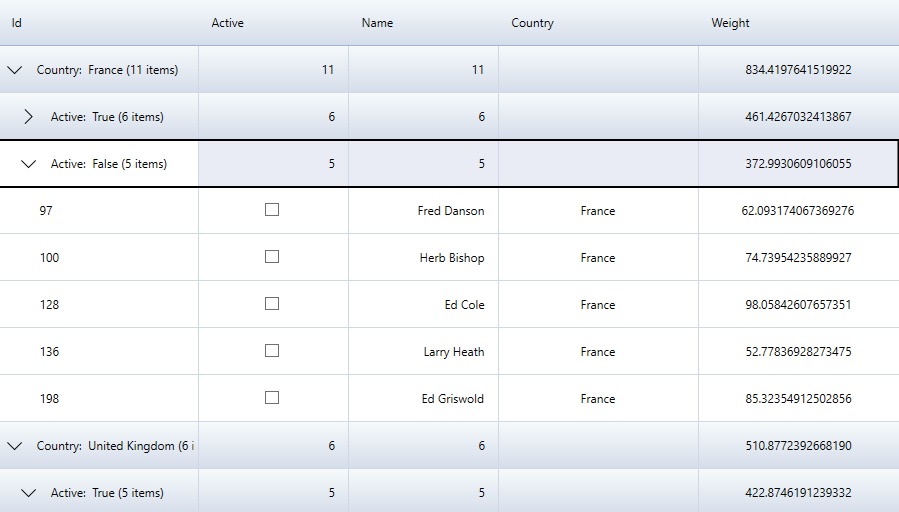
In the below example, a company's sales data grouped by Country Id can be more useful if the aggregate of columns can be indicated against each country in the grid itself. The GridColumn class provides the Aggregate property that can be set to Aggregate to automatically calculate and display aggregates. The aggregates calculated by setting the GroupAggregate property automatically recalculate the aggregate values when the data changes.
The following image shows a FlexGrid with aggregate values displayed in the columns.

To set aggregate through code
You can display the aggregate value for each group in FlexGrid by setting the Aggregate property on each column to one of the supported aggregate values. Some of the supported aggregate values are Sum, Average, Count, Minimum, Maximum, etc.
The following code illustrates displaying Count for Active and Name columns, and Sum for Weight through XAML.
<c1:FlexGrid Name='grid' AutoGenerateColumns="False" Style="{StaticResource excelBlue}" MinColumnWidth="10" MaxColumnWidth="300" HorizontalAlignment="Center" GroupHeaderFormat="{} {name}:  {value} ({count:n0} items)" HeadersVisibility="All" Height="700" Width="1000">
   <c1:FlexGrid.Columns>
      <c1:GridColumn Binding="Id" Width="200"/>
      <c1:GridColumn Binding="Active" HorizontalAlignment="Right" Aggregate="Count"/>
      <c1:GridColumn Binding="Name" HorizontalAlignment="Right" Aggregate="Count"/>
      <c1:GridColumn Binding="Country" Width="200" HorizontalAlignment ="Center" />
      <c1:GridColumn Binding="Weight" Width="200" HorizontalAlignment ="Center" Aggregate="Sum"/>
   </c1:FlexGrid.Columns>
</c1:FlexGrid>


