Adding Dashed Lines to a Bar Chart in Vue
Background:
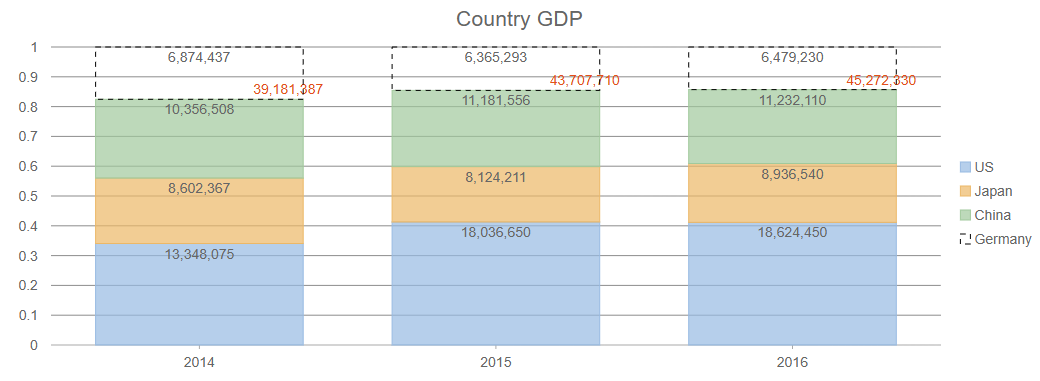
In data visualizations, dashed lines or patterns can communicate uncertainty, projections, or emphasize a specific segment visually. Wijmo’s FlexChart doesn’t support dashed bars natively, but with a bit of SVG manipulation during the chart's render lifecycle, we can inject custom stroke styles into the generated chart bars.
Steps to Complete:
- Hook into the rendered event
- Target the top series
- Customize SVG rect Attributes
- Update the Legend
Getting Started:
You can handle the rendered event of the flexChart and make all the modifications to the bars to achieve the desired appearance.
Hook into the rendered event
This lifecycle event is critical. It allows you to access the actual <svg> elements Wijmo draw and target specific bar series and style them differently. Wijmo charts render as SVG in the DOM, so by using DOM APIs (querySelectorAll, setAttribute), you can treat the bars like any SVG graphic.
rendered: function (s, e) {
let topSeriesRects = s.hostElement.querySelectorAll('.wj-series-group g:last-child rect');
...
}
Target the top series
In Wijmo, series are rendered in the order they’re declared. g:last-child rect selects the top-most series. Each rect element corresponds to a single bar in that series.
let topSeriesRects = s.hostElement.querySelectorAll('.wj-series-group g:last-child rect');Things to note: If your top-most series changes position (e.g. via dynamic data or reorder), the selector g:last-child rect may need to be adjusted. Also, this won’t work in SSR (server-side rendering) or environments where the DOM is inaccessible.
Customize SVG rect Attributes
Inside a loop, we update each bar's rectangle to give it a dashed black border and remove the fill color:
if (topSeriesRects.length) {
        let fill = null;
        topSeriesRects.forEach((rect, index) => {
          rect.setAttribute('stroke-dasharray', '5,5');     // Dashed outline
          fill = rect.getAttribute('fill');
          rect.setAttribute('fill', 'transparent');         // Transparent fill
          rect.setAttribute('stroke', 'black');            // Outline color
        });
This styling creates the dashed lines visual of a bar with dashed edges and no fill.
Update the Legend
To keep the legend matching the new dashed style, we also find the matching legend <rect> by its fill color, and update it too:
let legends = s.hostElement.querySelectorAll('.wj-legend rect');
legends.forEach((rect) => {
  if (fill == rect.getAttribute('fill')) {
    rect.setAttribute('fill', 'transparent');
    rect.setAttribute('stroke', 'black');
    rect.setAttribute('stroke-dasharray', '5,5');
  }
});
And that's how you get a chart where only one series (or part of it) is styled with dashed black outlines and a transparent fill with matching legend representation. This is perfect for projections, outliers, or what-if scenarios.
You can find the code used in an example application here.
Happy coding!

Andrew Peterson