How to perform various chart operations in Component one charts?

Posted by: amit.jain3 on 4 April 2023, 1:55 am EST

    • Post Options:
    • Link

    Posted 4 April 2023, 1:55 am EST - Updated 4 April 2023, 2:01 am EST

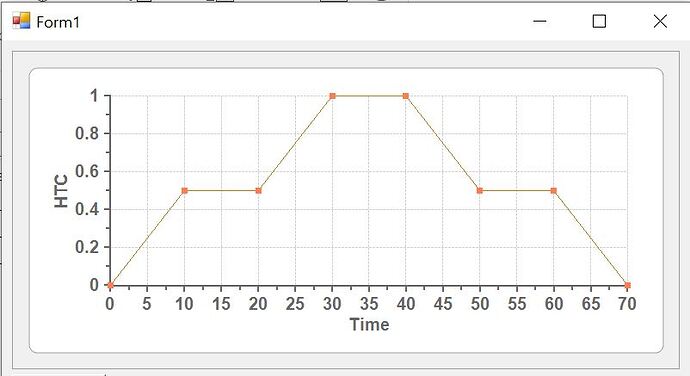
    Hello, I have created the Windows Form and using Component One chart as shown in the Image below. I am able to add the X-Y data, change the axis labels.

    I am trying couple of features , could you help me to understand are these possible or not in component one chart.

    1. Is it possible to insert/delete points in the chart ?
    2. How to enable Tooltip - I am using “c1Chart1.ToolTip.Enabled = true;” but it is not showing the tooltip on each plotted points.
    3. How to export the chart?

    Please help me to clarify all these points, whether it can be done or not?

  • Posted 5 April 2023, 11:08 am EST

    Hi Amit,

    1. In order to insert/delete the data points in C1Chart, you will need to update the C1Chart’s data array objects with the arrays of values. You can refer to the following code for the same:
    // add datapoint
        var currentSeries = c1Chart1.ChartGroups[0].ChartData.SeriesList[0];
        if (currentSeries != null && currentSeries.PointData.Length > 0)
        {
            
            currentSeries.X.CopyDataIn((currentSeries.X.CopyDataOut() as double[]).Concat(new double[] { 80 }).ToArray());
            currentSeries.Y.CopyDataIn((currentSeries.Y.CopyDataOut() as double[]).Concat(new double[] { 0.6 }).ToArray());
            c1Chart1.Update();
        }
    //remove data point
        var currentSeries = c1Chart1.ChartGroups[0].ChartData.SeriesList[0];
        if (currentSeries != null)
        {
            if(currentSeries.PointData.Length > 0)
            {
                currentSeries.PointData.RemoveAt(currentSeries.PointData.Length - 1);
                c1Chart1.Update();
            }
        }
    1. To show the tooltip for C1Chart, you will need to set the ChartDataSeries’ TooltipText property and set C1Chart’s ToolTip.Enabled property to ‘true’. Please refer to the attached sample for full implementation. See C1ChartApplication.zip.

    2. You can export the C1Chart using C1Chart’s SaveImage() method as shown in the following code:

    c1Chart1.SaveImage("../../ChartImage.png", System.Drawing.Imaging.ImageFormat.Png);

    Kindly refer to the attached sample for full implementation of all the requirements. See C1ChartApplication.zip

    For your information, it is recommended to use C1FlexChart instead of C1Chart control in WinForms applications. This is because C1Chart is considered a legacy control and has been replaced by FlexChart. In comparison to C1Chart, FlexChart is a more lightweight and faster option that offers better performance.

    Please let us know if you have any further concerns.

    Thanks & Regards,

    Aastha

  • Posted 5 April 2023, 11:11 pm EST

    Hello Aastha,

    Thank you for your response.

    I am also looking on using FLEX CHART instead of C1Chart.

    I am able to show tooltip and export the chart. Thank you for the solution for insertion and deletion of the points.

    Will it be same for Flex Chart as well and 1 more thing the code snippet you gave -

    Insertion - the point is hardcoded, but is it possible to select the point from the chart itself and insert.

    Deletion - I believe this is removing the last point from the array, but what if we want to select a specific point from the chart and than delete it.

  • Posted 6 April 2023, 10:03 am EST

    Hi Amit,

    > Will it be same for Flex Chart as well

    As there are a lot of differences in the APIs of FlexChart and C1Chart, this leads to differences in their implementation. To gain more insight into the implementation and features of FlexChart, you can consult the documentation link provided: https://www.grapecity.com/componentone/docs/win/online-flexchart/overview.html

    For insertion and deletion, you will first need to capture the mouse click position as shown in the following code:

    private void C1Chart1_MouseDown(object sender, MouseEventArgs e)
    {
        if(e.Button == MouseButtons.Left)
        {
            _pt = Control.MousePosition;
            
        }
    }

    > Insertion - the point is hardcoded, but is it possible to select the point from the chart itself and insert.

    You can achieve the desired behavior by referring to the following code:

    private void addBtn_Click(object sender, EventArgs e)
    {
        var currentSeries = c1Chart1.ChartGroups[0].ChartData.SeriesList[0];
        var pt = c1Chart1.PointToClient(_pt);
        if (currentSeries != null && currentSeries.PointData.Length > 0)
        {
            double x = 0, y = 0;
            if (currentSeries.Group.CoordToDataCoord(pt.X, pt.Y, ref x, ref y))
            {
                currentSeries.X.CopyDataIn((currentSeries.X.CopyDataOut() as double[]).Concat(new double[] { x }).ToArray());
                currentSeries.Y.CopyDataIn((currentSeries.Y.CopyDataOut() as double[]).Concat(new double[] { y }).ToArray());
            }
            c1Chart1.Update();
        }
    }

    > Deletion - I believe this is removing the last point from the array, but what if we want to select a specific point from the chart and than delete it.

    You can achieve the desired behavior by referring to the following code:

    private void deleteBtn_Click(object sender, EventArgs e)
    {
        var pt = c1Chart1.PointToClient(_pt);
        int pntInd = 0, dist = 0;
        var currentSeries = c1Chart1.ChartGroups[0].ChartData.SeriesList[0];
        if (currentSeries != null)
        {
            if(currentSeries.PointData.Length > 0)
            {
                if(currentSeries.Group.CoordToPointIndex(pt.X, pt.Y, PlotElementEnum.Points, 0, ref pntInd, ref dist))
                {
                    if(dist < 10)
                    {
                        currentSeries.PointData.RemoveAt(pntInd);
                    }
                }
                c1Chart1.Update();
            }
        }
    }

    Kindly refer to the attached sample for full implementation. (C1ChartApplication_Mod.zip)

    Thanks & Regards,

    Aastha
  • Posted 6 April 2023, 12:53 pm EST - Updated 6 April 2023, 12:58 pm EST

    Hello Aastha,

    Thank you for your help.

    The Snippet you shared for adding the point and deleting on user selection is working.

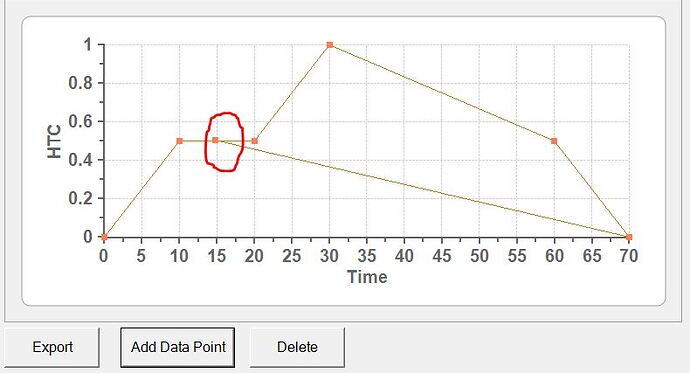
    I tried that and it is adding as shown in the image I attached.

    But I tried adding it in between 2 points it should add it there but I believe it adds the point in the last of the array it is creating the “line” to show.

    but if it is in between points it should embed in between not to add it in the last of the array. for this we need to find the previous and next point then maybe we can add it in the X and Y array.

    So is it possible to do it. To get the other points?

  • Posted 10 April 2023, 2:49 pm EST

    Hi Amit,

    Apologies for the delay in response.

    To add new data points in between the existing data points, you can use the “ChartGroup.CoordToDataIndex” method to get the closest Data Index. Further, you can insert the new data point as per that Data Index. Please see the updated sample project showing the same.

    Attachment: C1ChartApplication_updated.zip

    Best Regards,

    Kartik

  • Posted 11 April 2023, 1:13 am EST

    Hello Kartik,

    Thank you for your response.

    I just have 1 more question, is there a way to know which is the equivalent functions for Flex Chart and Chart.

    The snippet shared to me is for the Legacy Chart, I am trying the similar for Flex Chart a well since I am new to this Library I am unaware of the similar functions in Flex Chart. So is there any document which I can refer and replicate the same.

    Once again Thank you for your help.

  • Posted 11 April 2023, 1:19 am EST - Updated 11 April 2023, 2:29 am EST

    Sorry for asking multiple Questions,

    Is it possible to drag the plotted points in Legacy Chart or Flex Chart

  • Posted 11 April 2023, 9:37 am EST

    Hi Amit,

    Because the C1Chart API is somewhat old, many changes have been implemented in the C1FlexChart API to make it more robust and usable. Therefore, there is no such mapping for equivalent methods of C1Chart and the C1FlexChart.

    You can go through the documentation of the C1FlexChart using the link below, which also includes an API reference at the end. You can refer to that API reference for all information related to the properties, methods, and events of the C1FlexChart.

    (https://www.grapecity.com/componentone/docs/win/online-flexchart/overview.html)

    Furthermore, you can also refer to the product samples of C1FlexChart, which can be found at the location Documents\ComponentOne Samples\WinForms\vX.X\FlexChart\CS in your system.

    Note: The product samples will be available only if you have the C1 WinForms controls installed on your system. If you haven’t already, use the link below to get the ComponentOneControlPanel installer.

    (https://www.grapecity.com/componentone/download)


    We’ve attached another sample project with a similar implementation to our previous response, but this time with the C1FlexChart control.

    Also, we are currently investigating your requirement of “dragging the plotted points” to see if is possible in the C1FlexChart. We will let you know the updates as soon as possible.

    Attachment: FlexChart_PlotPointsAtRuntime.zip

    Thanks, and Kind Regards,

    Kartik

  • Posted 12 April 2023, 3:38 am EST

    Hello Kartik,

    Thank you for your response and sharing me the snippet for flex chart as well.

    I believe we need to select the point using Mouse_rendered and click on the button “AddPointToolStripMenuItem_Click” to insert it.

    I do have doubt though in a this function - AddPointToolStripMenuItem_Click

    Inside this function var DataSeries = flexChart1.DataSource as List;

    this will always be null, it should point to the datasource which is already plotted.

    Please let me know if I am getting all this wrong.

  • Posted 12 April 2023, 4:09 am EST - Updated 12 April 2023, 5:04 am EST

    I believe I get it, When you created the datasource for flex chart it is created as PointF which only have x and y…

    But my data source has

    List _list = new List();

    _list.Add(new Product() { X=0,Y=0,Data=300 });

    _list.Add(new Product() { X=10,Y=0.5,Data=350 });

    Is like this so still the snippet will be same or it will be changed to PointF.

    Because If I am using the same snippet I am getting an error

    In addition to it… the snippet has 1 more button “Clear selection” that is just clearing the selection. but If I want to delete a selected point than how it can be done. Since we don’t have any method Series.Delete

  • Posted 12 April 2023, 6:34 am EST

    Hi Amit,

    For your requirement of “dragging the plotted points” (https://www.grapecity.com/forums/winforms-edition/how-to-perform-various-chart-operations-in-component-one-charts#66377), we have created a sample project which uses the MouseDown, MouseMove, MouseUp, and Rendered events of the C1FlexChart to implement the same. The sample project is attached below for your reference.

    Attachment: FlexChart.DragPoints.zip


    FYI, we have used the code

    var DataSeries = flexChart1.DataSource as List<PointF>;

    in our projects because we have bound the FlexChart directly to a List of Points.

    If you have a custom class object that contains the data points, you can create a list of these objects and assign it as the DataSource of the FlexChart instead.

    In this scenario, the same code snippet might not work for you and you will just need to make some minor changes to our code to customize it as per your custom object. You will need to replace the use of “PointF.X” and “PointF.Y” DataPoints in our code with DataPoint fields of your custom object (for ex. “Product.X”, “Product.Y”)


    For deleting a point, you can check if the clicked location is very close/above an actual data point. If true, you can delete this point from the DataSource of the FlexChart and then Rebind the FlexChart. We have updated our previous sample project and added a button to delete a point.

    Attachment: FlexChart_PlotPointsAtRuntime_updated.zip

    Thanks, and Best Regards,

    Kartik

  • Posted 12 April 2023, 6:48 am EST

    Thank you Kartik

    I have already done the Delete Point…

    I’ll have a look into the Drag and Drop and let you know, if I have any doubts

  • Posted 12 April 2023, 7:12 am EST

    Hi Kartik,

    Inn the previous comments you I have got a solution to zoom in in flex chart which also uses the same MOUSE operations which you have used in dragging points.

    So we can either drag the points or zoom or can we do both from a single function

  • Posted 12 April 2023, 7:28 am EST

    Sorry Kartik,

    I have got the solution I can use checkbox and based on that can switch between zoom and drag points.

    Anyways, Thank you so much for helping me to understand these things about Chart/Flex Chart.

  • Posted 12 April 2023, 7:51 am EST

    Hi Amit,

    We are pleased that we were able to assist you in meeting your requirements. If you need any other information, please create a new thread on the forum/support portal, as this one has become quite lengthy, and continuing it may cause confusion.

    Best Regards,

    Kartik

Need extra support?

Upgrade your support plan and get personal unlimited phone support with our customer engagement team

Learn More

Forum Channels