Posted 30 January 2019, 2:11 am EST - Updated 3 October 2022, 8:12 pm EST
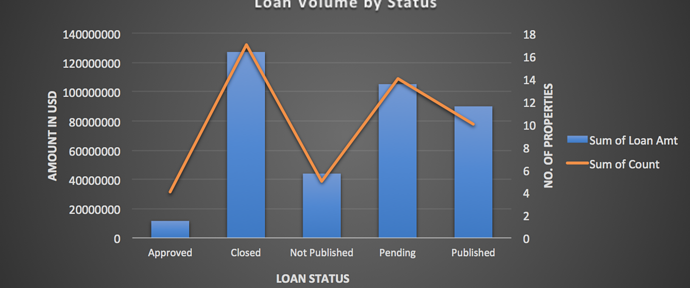
Pivot Chart - Show dual axis with different chart types
Posted by: singh.jagdeep91 on 30 January 2019, 2:11 am EST
-
-
Posted 31 January 2019, 12:43 am EST
Hi,
Please refer to the following sample demonstrating the required functionality:
https://stackblitz.com/edit/angular-iw9rmq?file=app%2Fapp.component.ts
The basic idea is that first we get an instance of the underlying FlexChart object using the flexChart property of the pivotChart. And then we can customize the underlying flexChart just like a normal flexChart.
Please refer to the following sample to get started with the flexChart customization:
https://demos.wijmo.com/5/PureJS/LearnWijmo/LearnWijmo/#zrbukdvm~Sharad


