Hi Benoit,
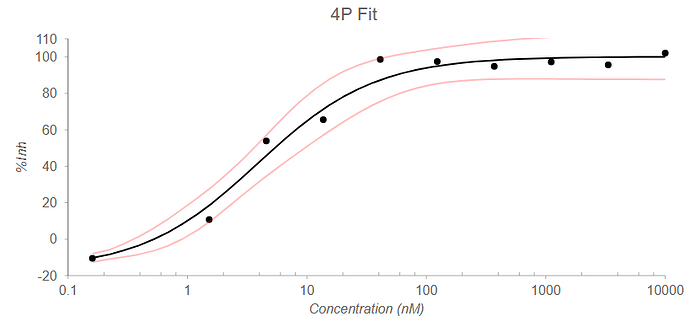
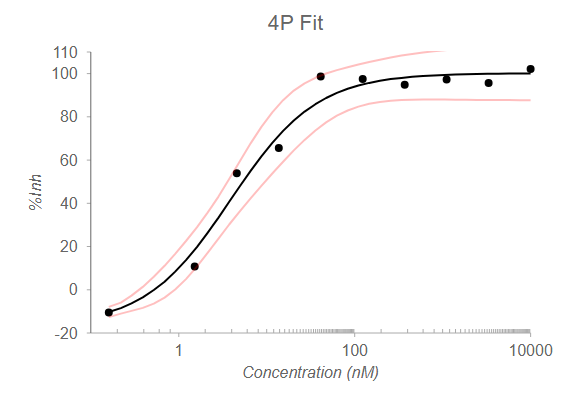
After investigating the first issue we found that this is the expected behavior for now. This happens because minor ticks are calculated based on the ‘minorUnit’ value and a new minorUnit value is calculated with an algorithm for each range of major ticks on the axis. For example, we get the following results for minorTicks -
(2, 3, 4, 5, 6, 7, 8, 9), (20, 30, 40, 50, 60, 70, 80, 90), (200, 300, 400, 500, 600, 700, 800, 900) when minorUnit = 1 and majorTickMarks are - [1,10,100,1000]
But when in any case, a majorTick label is skipped, lets say 10, then in that case the first range will be 1-100 instead of 1-10, which results in 98 minor ticks to be rendered between 1-100 as minorUnit is 1. In this case, we would like to know about your opinion, that what would be the expected results, how many minorTicks should be rendered for 1-100 and 100-1000, when visible majorTick ranges are - [1,100,1000]. It will help us enhance the algorithm to produce better results.
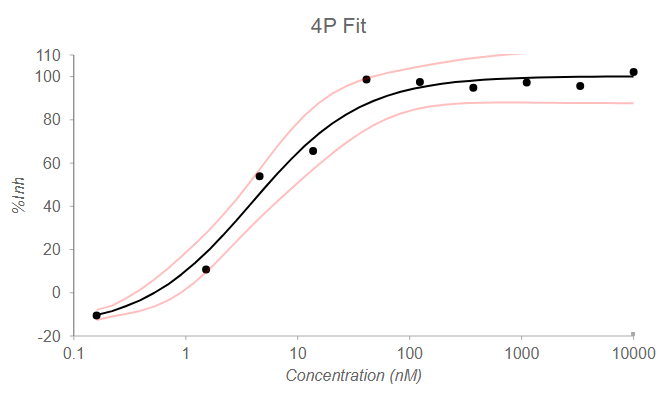
Regarding the second issue that occurs after setting the ‘labelMin’ and ‘labelMax’ properties to true, we have forwarded this issue to the engineering team for further investigation, as this behavior is not as expected. For now, you can use the following workaround to avoid this issue -
// Workaround
(wjChart as any).Axis.prototype._addMinMaxLabels = function (t: any, e: any) {
    if (this.labelMin) {
        var i = this.actualMin;
        if (isFinite(i) && t.indexOf(i) == -1) {
            e.splice(0, 0, this._formatValue(i));
            t.splice(0, 0, i);
        }
    }
    if (this.labelMax) {
        var r = this.actualMax;
        if (isFinite(r) && t.indexOf(r) == -1) {
            e.splice(0, 0, this._formatValue(r));
            t.splice(0, 0, r);
        }
    }
};
//
Please find attached a workaround sample demonstrating the same. The exact same issue was not replicated on our end as visible in the screenshot you shared, so in case, if the issue still persists after applying the workaround, please share a small sample in which the issue can be replicated, so that we can investigate the issue further and assist you accordingly. You can also modify the attached sample to replicate the issue and share it with us.
Regards
workaround_sample.zip


