Accessibility for Graphs and Charts

Posted by: srilata.iyengar on 19 August 2024, 6:02 am EST

  • Posted 19 August 2024, 6:02 am EST - Updated 19 August 2024, 6:07 am EST

    Hi Team,

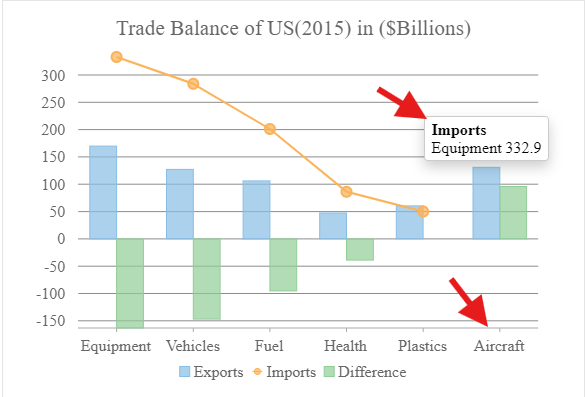
    We are using Wijmo Charts and Graphs on our product, however with the recent compliancy requirements under AODA and ADA we noticed that the charts are not keyboard accessible.

    for example

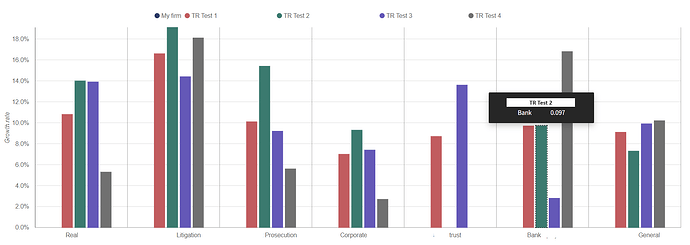
    In the image you can see that the chart i can focus with mouse but not with keys, is there any workaround for this problem?

  • Posted 21 August 2024, 12:54 am EST

    Hi Srilata,

    We can add keyboard accessibility features using the following steps-

    *First, we need to make elements focusable using tab, that is assigning tabIndex = 0 to the elements we want to focus.

    *Then we add focus, and blur event handlers to add styles to the element to be able to see the focus visually.

    *We have to do the above steps in the rendered event of FlexChart, read more about it here: https://developer.mescius.com/wijmo/api/classes/Wijmo_Chart.Flexchart.html#rendered.

    *You can also add aria-label to the elements that you are making focusable. This step is optional, things will work even if there is no aria-label. read more about aria-label here https://developer.mozilla.org/en-US/docs/Web/Accessibility/ARIA/Attributes/aria-label

    Here is a sample https://stackblitz.com/edit/js-x8gjlh?file=index.js,

    Please have a look at it for a better understanding.

    In case you need further assistance do let us know.

    Thanks, and Regards

  • Posted 26 August 2024, 7:00 am EST

    Thank you so much for this solution. In addition to this, i noticed that the tool tip with the data points is not showing in the graph while tabbing and when using the mouse, when a datapoint is selected the tool tip should be available until dismissed

    https://techservicesillinois.github.io/accessibility/aria-examples/tooltip.html

    can you please help with the same on the graph?

  • Posted 27 August 2024, 3:27 am EST

    Hi Srilata,

    To achieve your desired result, follow these steps.

    1. Set the tooltip trigger to 0, which is focus, you can read more about it here: https://developer.mescius.com/wijmo/api/enums/Wijmo.Tooltiptrigger.html

    2. Override mousemove and mouseleave event Listeners by setting useCapture to true.

    3. Set the tooltip content and show the tooltip on focus event using show method.

      Read more about show method : https://developer.mescius.com/wijmo/api/classes/Wijmo_Chart.Charttooltip.html#show

      Read more about content : https://developer.mescius.com/wijmo/api/classes/Wijmo_Chart.Charttooltip.html#content

    Please refer to this updated sample https://stackblitz.com/edit/js-a3qn2a?file=index.js, for better understanding.

    In case you need further assistance, do let us know.

    Thanks, and regards

  • Posted 2 September 2024, 1:01 am EST

    Thank you, i was able to accomplish the tool tip with keyboard navigation.

    However i had two questions

    1. i can see that aria-label is being applied and i even gave a role but NVDA is not reading anything within the grid despite it being keyboard accessible.
    2. We are also using mouse for tool tip navigation and as per WCAG 2.1 Level A & AA Baseline
    3. Pointer and Hover - “Ensure content that appears on hover or focus is persistent until dismissed, not valid, or the trigger is removed”. However the tooltip is not persistent. If i move from the data point to the tooltip the tooltip goes away when it should not.
  • Posted 3 September 2024, 6:44 am EST

    Hi Srilata,

    We tried to replicate the issues described but we weren’t able to.

    1. We used NVDA to read the screen and it did fine, please refer to the attached video file for your reference.
    2. In the previously shared sample, we set the trigger to 0, and then added the event listeners of mouse enter and mouse move, where we prevent default. We can do the same again without any condition (trigger == 0) and that will enable the hover behavior.
    3. The current behavior is a design choice as when we try to move from the point to the tooltip the hover target become invalid and therefore the tooltip diminishes. But if you wish to do that then you can add custom eventHandler for mouseover event and can show the tooltip accordingly.

    Here is an updated sample https://stackblitz.com/edit/js-4a5gzf?file=index.js.

    Here is an attached video,MESCIUS_Wijmo_FlexGrid_Nested_Grids_-_Brave_2024-09-03_15-50-28.zip

    where we were not able to reproduce the error described in the first point, as NVDA was able to read the chart and its elements, and the tooltips.

    We would suggest you go through the sample again and if you are still getting issues with NVDA do let us know and share a sample where the issue could be reproduced. You can also update the attached sample and share it with us.

    Thanks, and regards.

  • Posted 5 September 2024, 5:11 am EST

    Thank you for the help with the tooltip, we were able to make the tooltip persistent.

    We are still facing issues with NVDA even after using the code provided, The aria-label is being applied and also being reflected in the DOM but is not being read out by the Screen Reader, in our case NVDA.

    When we check the example you’ve provided, we are able to get the screenreader to pick that up however it is not working on our code.

    I am not sure how to share the sample of our code as this is part of a larger project. However we can show you the modification we made to our code to include your code in it.

    https://stackblitz.com/edit/js-72yv6n?file=sample-code.js,sample-code.html

  • Posted 6 September 2024, 5:32 am EST

    Hi,

    We tried to replicate the issue on our end, but we weren’t able to. We are not sure what is causing the issue. But please look for aria-hidden property that might interfere with the aria-label Read more about aria-hidden here : https://developer.mozilla.org/en-US/docs/Web/Accessibility/ARIA/Attributes/aria-hidden.

    Also, we could see that you binded a function chartRenderedCalled to the event rendered and then handled the rendered event in the function chartRenderedCalled. The efficient and correct way would be to bind the function chartRenderedCalled to the initialized event instead of rendered event as rendered event is triggered multiple times while interacting with the chart.

    As we are not able to replicate the issue, it would not be possible to comment on the actual cause of the issue, we can help you better if we can replicate the issue on our end. So, please try to provide us with a sample where the issue is replicated, you can also update the attached sample and share it with us.

    Sample : https://stackblitz.com/edit/angular-spfctt?file=src%2Fapp%2Fapp.component.ts

    Thanks, and regards.
  • Posted 6 September 2024, 6:33 am EST - Updated 6 September 2024, 6:41 am EST

    Thank you for advice on the NVDA issue we will look into it.

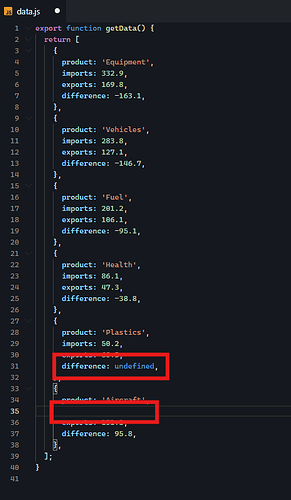
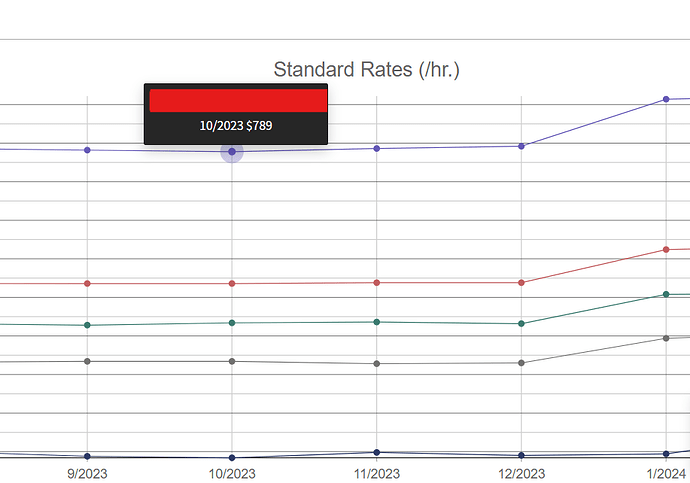
    Also regarding tooltips, we found an issue while running a test case which was when you remove y-axis values, that is, when the length of each series is different in data.js in the the attached sample,

    Sample: ‘https://stackblitz.com/edit/js-4a5gzf?file=index.js

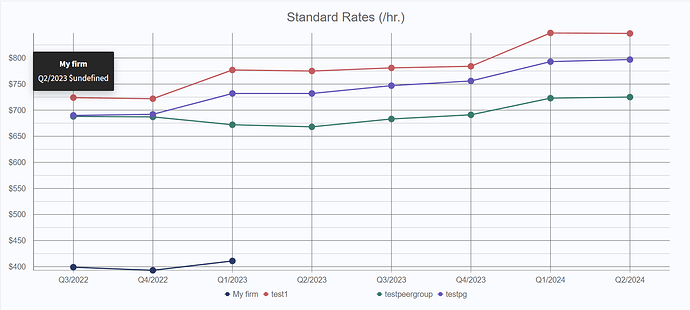
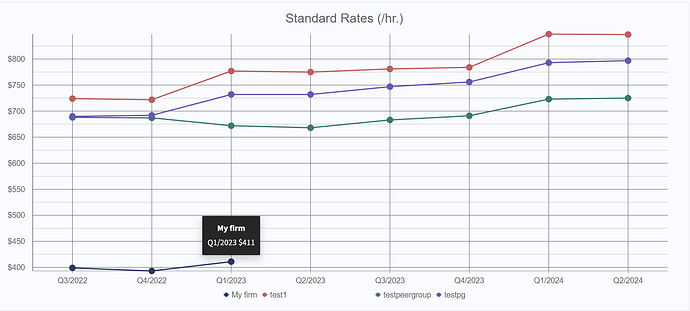
    The tooltip shows values out of order as shown in the attached images.


    Is there the fix for how to add tooltips when each series does not have the same number of elements?

  • Posted 9 September 2024, 4:59 am EST - Updated 9 September 2024, 5:06 am EST

    This is a sample of where we implemented the tooltip and it gives us the wrong information as data is not required to be filled in all fields(uneven data):

  • Posted 9 September 2024, 11:33 pm EST

    Hi Rajesh,

    In the previous sample, we assumed that each series would have the same number of elements. However, based on the use case you provided, that assumption is no longer valid. We’ve updated the logic to accommodate cases where the number of elements in the series differs.

    Please take a look at the updated sample here: https://stackblitz.com/edit/js-j7t5w8?file=index.js.

    Please let us know if you still have any issues or have doubts.

    Regards

  • Posted 10 September 2024, 8:58 am EST - Updated 10 September 2024, 9:03 am EST

    Hello Sonu,

    Thank you so much for the solution, however in some scenarios we are finding some issues. This code works perfectly when values are missing from the extremes but when values are missing in the middle.

    In the provided table as you can see a value in the middle is missing and hence the tooltip is not being applied on the last bar (TR Test 2 -General)( Value: 7.3% from the table ) and it is not mouse and tab focusable. The focus moves directly from the focused tab shown in the plot image (TR Test 2 Bank 0.097) to the next series that is TR test 3 bars skipping the last green bar. This issue also happens for TR Test 4 as that has a missing value as well.

    We have modified the updated file to show you the difference in the stackblitz link with different data values to replicate our issue:https://stackblitz.com/edit/js-yu4fek?file=data-updated.js,data.js


    Regards

  • Posted 12 September 2024, 12:52 am EST

    Hi Rajesh,

    To be able to meet your requirements, we need to iterate the elements and values differently, with different indexes and assign values accordingly.

    Please have a look at the sample from line 42 to 142 https://stackblitz.com/edit/js-wzaqqw?file=data-updated.js for better understanding.

    In case you need further assistance do let us know.

    Thanks, and regards

  • Posted 17 September 2024, 3:35 am EST

    Thank you for your assistance Vivek and Sonu,

    The fixes you provided work perfectly for our code. We still are facing issues with NVDA as it is still not working as required. If we need further assistance is it possible for us to get on call to discuss the issue?

    Thanks and Regards

  • Posted 19 September 2024, 8:59 am EST

    Hi Samay,

    I’ve created a support ticket for us to coordinate and schedule the meeting. Please continue our conversation there. You can find the support ticket in the “Support Tickets” section of your Grapecity account, or access it directly using the link below:

    https://developer.mescius.com/my-account/my-support/case/CAS-52548-B0W4J9

    Regards

Need extra support?

Upgrade your support plan and get personal unlimited phone support with our customer engagement team

Learn More

Forum Channels