Posted 23 May 2022, 1:28 pm EST - Updated 29 September 2022, 3:46 pm EST
Hi,
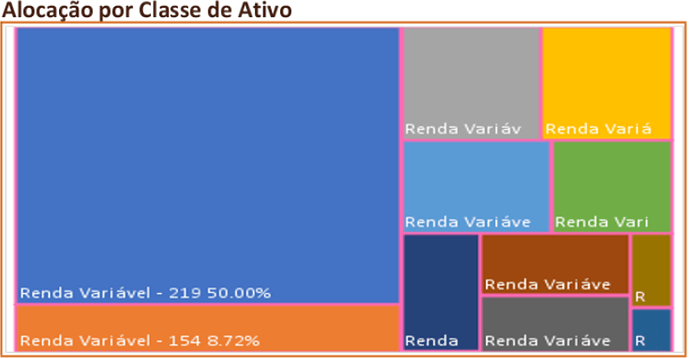
I need to change the colors that make up the treemap graphic.
Currently for each category/value of the chart, we have a specific color in RGB that we get from the database.
How do we apply these colors to each chart category using Java ?
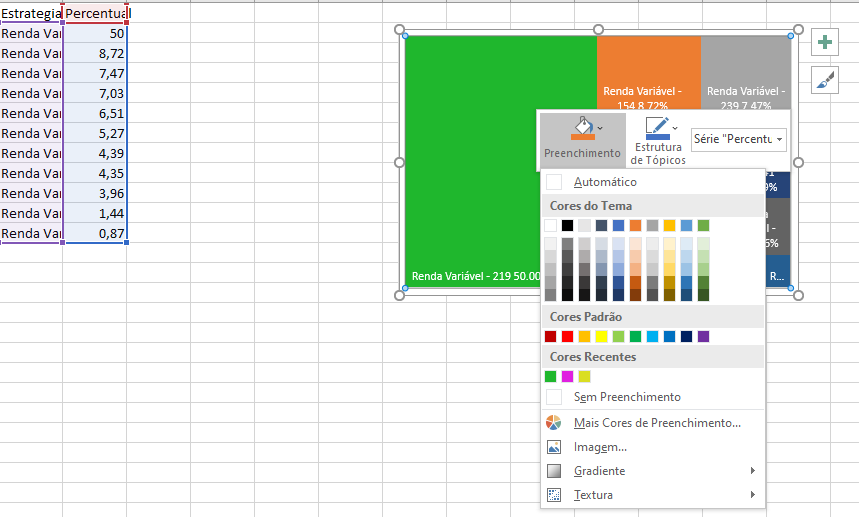
In Excel, we do this as follows:
In the chart, select a category manually, right click, fill, and choose a color (for each of the categories).
// Create a new workbook
Workbook workbook = new Workbook("License Key");

IWorksheet worksheet = workbook.getWorksheets().get(0);
		worksheet.getRange("A1:B"+finalPosition).setValue(Values); //define o alcance de células com dados na planilha

//Create a treemap chart.
IShape shape = worksheet.getShapes().addChart(ChartType.Treemap, 300, 20, 300, 200);
		shape.getChart().getSeriesCollection().add(worksheet.getRange("A1:B"+finalPosition));

//Set the parent data labels are displayed as banners.
		shape.getChart().getSeriesCollection().get(0).setParentDataLabelOption(ParentDataLabelOptions.Banner);

		//Modify chart title text.
		shape.getChart().getChartTitle().setText("Alocação por Categoria");
		shape.getChart().getChartTitle().delete(); //deleta as legendas do gráfico
		shape.getChart().getLegend().delete(); //deleta o título do gráfico

		ISeries series1 = shape.getChart().getSeriesCollection().get(0);


