Coloring Multilevel charts

Posted by: bnguyen on 30 January 2024, 2:41 am EST

    • Post Options:
    • Link

    Posted 30 January 2024, 2:41 am EST - Updated 30 January 2024, 2:46 am EST

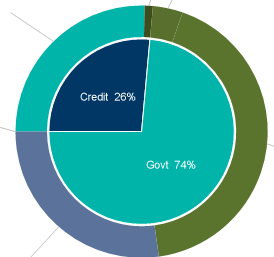
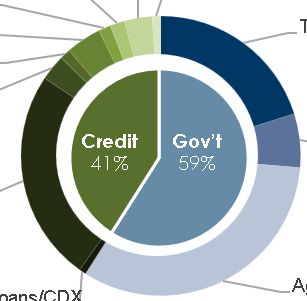
    How can we set the color palette based on parameter? For example, The donut chart will have similar color hues for credit and similar color hues for Govt. Please see attached what I currently have and what I am trying to do.

    Ther will be a variable number of groups in the donut chart so I cannot just paste them in the palette or the colors will shift from chart to chart.

    Is it also possible to rotate the charts?

  • Posted 31 January 2024, 4:29 pm EST

    Hi Bryan,

    You can store multiple arrays for different palettes in your report script and add a palette parameter to choose the palette for your chart.

    In the script, you’ll also need to create a custom method to get the particular color from the palette array based on the palette parameter selected and the index of color in your CustomPalette.

    Now in the ‘CustomPalette’ property of your chart, you can add multiple colors for the number of maximum colors you’ll have for your chart, and call your custom method by passing in the palette parameter value and the index of the color for eg.

    =Code.GetColor(Parameters!PaletteParameter.Value, colorIndex)
    .

    Please find attached a sample implementing the same.

    >> Is it also possible to rotate the charts?

    Unfortunately, it is not possible to rotate charts in ActiveReports.

    Regards,

    Anand

    ChartPalette.zip

  • Posted 1 February 2024, 5:23 am EST

    Thank you Anand, that was very insightful. Is it also possible to set a color palette for the donut chart based on the value of the pie chart inside?

  • Posted 1 February 2024, 8:59 pm EST

    Hi Bryan,

    AFAIK it is not possible to select the color palette based on your other chart, however, you can add multiple plots in a single chart and set the Color encoding in both of your charts to a common group i.e. a group common in your Donut and Pie chart for eg. Credit & Gov’t. This way each of the values in your donut chart will have the same color encoding for Credit values and the same color encoding for all Gov’t values.

    To have a similar color palette for all credit values in your donut chart but not the same color we have escalated the case to our development team to get further insights on the same [Internal Tracking ID: AR-32676]. We’ll let you know of any updates regarding the same.

    >> Is it also possible to rotate the charts?

    After discussing this issue with my peers we did find a way to rotate your pie/donut chart, for this, you can select the Plot you want to rotate and set its ‘StartAngle’ property in degrees to as much as you want to rotate the chart.

    Thanks,

    Anand

    NestedChart.zip

  • Posted 2 February 2024, 2:36 am EST

    Thank you Anand. You have been very helpful. Please update me once you receive any updates from the dev team

Need extra support?

Upgrade your support plan and get personal unlimited phone support with our customer engagement team

Learn More

Forum Channels