A Powerful JavaScript Reporting Solution
ActiveReportsJS is a reporting solution for visualizing data in front-end applications. Customize report layouts and integrate our report designer and viewer components into web applications to preview, export, or print reports on any platform
- Design reports with our cross-platform standalone designer app
- Create responsive, mobile-friendly reporting applications
- Built-in support for Angular, React, and Vue
- Enable reporting on the client without server dependencies

Trusted by Leading Companies

Why Choose ActiveReports for Your JavaScript Reporting Applications?
JavaScript Reporting Engine
Leverage the powerful reporting engine to load and generate your reports in JavaScript on any device.
Multiple Report Types
Fulfill your requirements for a reporting solution by building printable, analytical, interactive, or fixed-layout reports.
Zero Server Dependencies
Forget about back-end dependencies and focus on the reporting functionality of your client-side application.
Client-Side Exporting and Printing
Allow your end-users to quickly print or export report output to PDF, Tabular Data, or HTML formats providing the document settings.
Design Interactive JS Reports
Provide report readers with comprehensive data visualizations including drill-down, drill-through, runtime sorting, and other interactive capabilities.

Tabular Reports
Build inventory lists, product catalogs, and other Tabular Reports organized in a multicolumn, multirow fashion and apply conditional formatting, grouping, sorting, and filtering to the data based on pre-defined conditions or user input.

Banded Reports
Build product catalogs, people directories, and other list-like data views with Banded Reports organized with multiple types of sections that display data in a free-form layout fashion.
Fixed Reports
Build purchase orders, quotes, parking tickets, and other pre-printed forms with unparalleled accuracy using the unique Fixed Layout Reports. The output of such a report is a completed form that you can view in a browser, print, or export to one of the supported formats and share the export output with interested parties.

Summary Reports
Build summary reports that reduce a complete, often large, set of raw data into smaller views that help yield useful information. Group, sort, and filter the data based on pre-defined conditions or user input with pivot tables or charts.

Drill-down Reports
Build interactive analytical reports that allow a reader to switch between a comprehensive data view and a more detailed one.

Drill-through Reports
Build interactive reports that allow a reader to navigate back and forth between the main report and a sequence of subreports by clicking parametrized links.

Serverless Reporting
Integrate ActiveReportsJS reporting engine into your front-end applications using NPM packages, CDN-hosted, or app-hosted JavaScript code with ZERO server-side dependencies.

Embeddable Components
Allow end-users of your app to preview a report output and modify it on the fly by integrating Viewer and Designer components.

Seamless Integration
Use Angular, React, and Vue libraries to easily integrate ActiveReportsJS components into your application.

Create Reports Programmatically
Build custom report designers using the API supplied with TypeScript declarations.
JavaScript Reporting Top Features

Cross-Platform Tools
Build interactive, customizable reports with a multi-platform standalone designer application.

Powerful Data Binding
Bind a report to the REST API, OData, or GraphQL end-point in no time with the advanced data binding capabilities.

SORT Function
Choose among two layout types and dozens of controls to create a pixel-perfect report.
Personalized Reporting
Make use of the Report Designer component to let users fine-tune reports.

Perfect View
Give end-users of your application the ultimate view, export, and print capabilities with the Viewer component.

Front-End Frameworks Support
The intersection operator returns the value from an array that intersects with the cell using the operator.
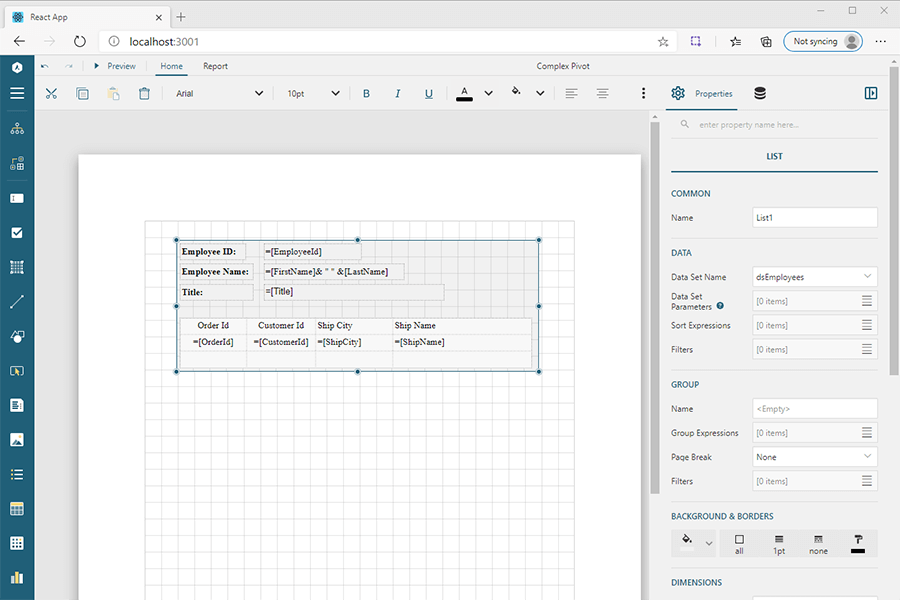
Standalone Report Designer
Build interactive, customizable report templates with a cross-platform report designer application.

Install on your OS
The standalone report designer can be installed on Windows, Mac, or Desktop Linux.
User-friendly Interface
Create printable, analytical, or interactive reports using the intuitive interface and a rich set of data visualization components.
JSON Report Templates
Save report templates in JSON format and integrate them into your application as static resources or dynamic modules.
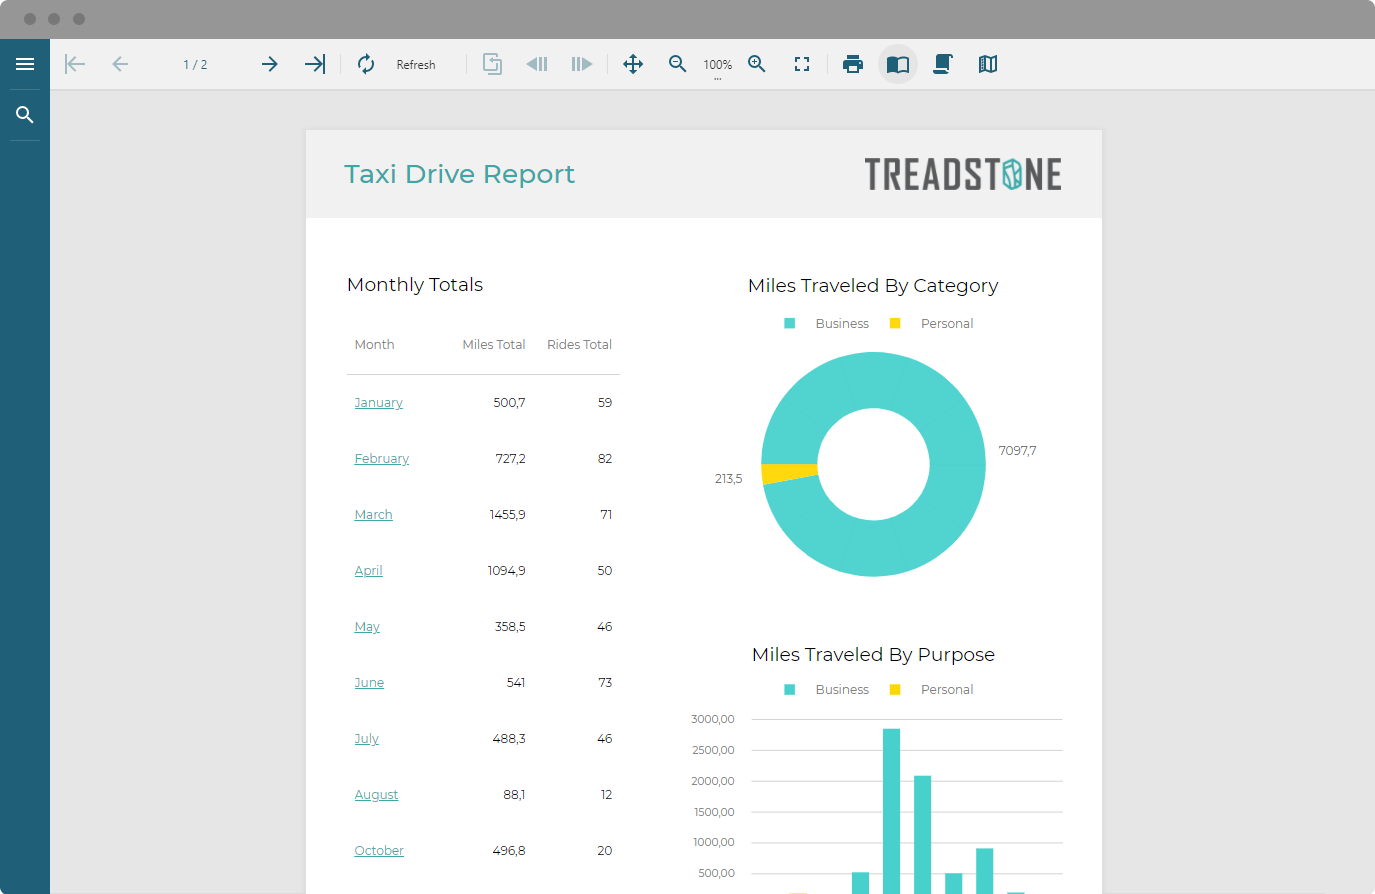
Embeddable JavaScript Report Viewer
Give end-users of your application the ultimate view, export, and print capabilities with the Viewer component.
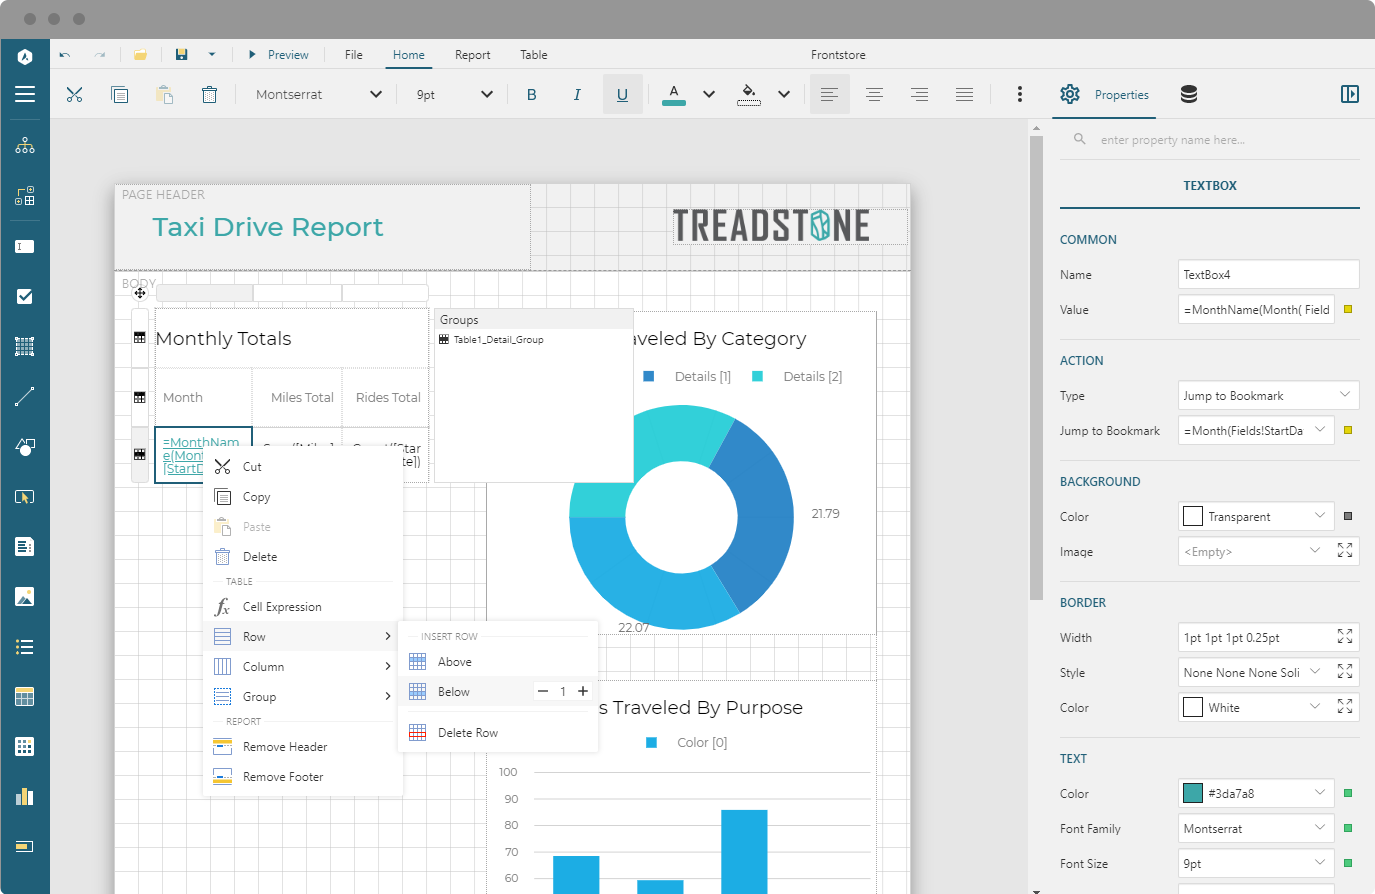
Embeddable JavaScript Report Designer
Make use of the Report Designer component to let users fine-tune reports.
Flexible Integration
Use the API to define the application-specific functions for creating, saving, opening, and previewing your reports.
Rich Customization
Change the color scheme using one of the pre-defined themes or create your own theme.
Multilingual Support
Provide your users with the translated texts for the viewer UI elements such as tooltips and buttons.