
Get Started With Banded Reports
Introduction
A banded report is a way to present your data with a list-like view where each data record displays in a free-form layout fashion. In ActiveReportsJS you can build such a report using List or Banded List data regions. We recommend using the latter because it provides a flexible layout organized with multiple types of sections called bands. Examples of banded reports are product catalogs, people directories, and others.
In this tutorial, we build the Employee Directory from the ground up, providing experience with the typical report designing process. By the end, you will be able to do the following:
Create a new report
Bind the report to the OData API
Use the OData $select query option to reduce the volume of retrieved data
Create a Banded List data region
Configure data grouping within the Banded List and use header, group header, and details sections to display various bits of information
Use the Container report item to decorate bands appearance
Use the TextBox report item to display textual information
Use the Image report item with Conditional Data Binding
Display the Report Map for easy navigation through the report
Upon completion of all tutorial steps, the final report will look like this: live demo.
Prerequisites
The following content assumes that you have the Standalone Report Designer running. Visit the tutorial for detailed information. A stable internet connection is also required to access the Demo Data Hub.
Creating a New Report
In the standalone report designer, click the File menu and select the Continuous Page Layout template for a newly created report. Click anywhere on the gray area around the report layout to load the report properties in the properties panel. In the Margins section, set the Style property to Narrow to change the report page margins size.
Expand to watch creating a new report in action
Data Binding
Data binding establishes a connection between a report and the data it displays. In this tutorial, we use the MESCIUS Demo OData API that contains the sales data for a fictitious company called Contoso that is a manufacturing, sales, and support organization with more than 100,000 products.
Adding Data Source
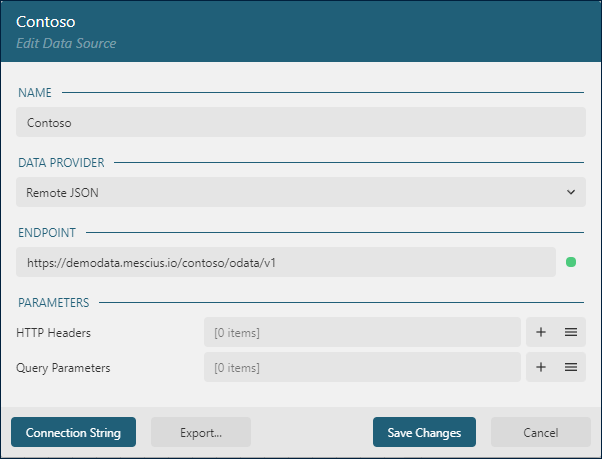
You can think of the Contoso OData API as the "database" that you can connect to using its root URL https://demodata.mescius.io/contoso/odata/v1, and that has multiple "tables" which presented with endpoints such as /DimCustomers, /DimStores, and /DimProducts. You can create a Report DataSource that establishes the connection to such a "database" using the following steps.
Open the Data panel of the property inspector and click the
Addbutton.In the Data Source editor dialog, type
Contosoin the NAME field andhttps://demodata.mescius.io/contoso/odata/v1in the ENDPOINT field.Click the
Save Changesbutton
Adding Data Set
Data Sets represent one or more endpoints of the Data Source. For the Employee Directory Report, we need to access the data from the /DimEmployees endpoint of the Contoso Data Source that we added in the previous section.
Use the following steps to add the Employees data set:
Click the
+icon nearContosoin the Data panel.In the Data Set Editor dialog, type
Employeesin the NAME field,/DimEmployeesin the Uri/Path field, and$.value.*in theJson Pathfield.By default, each
Employeerecord includes 28 fields, but we don't need them all. Therefore we limit the retrieved fields by applying the OData $select query option via a query parameter.Click the
+icon on the right side of theParameterssection.Type
$selectin theParameterfield of the newly addedParameteritem.Type
FirstName, LastName, MiddleName, Title, EmailAddress, Phone, DepartmentName, AvatarUrlin theValuefield of the sameParameteritem.
Click the
Validatebutton.Ensure that the
DataBase Fieldssection displays[8 items]text.Click the
Save Changesbutton.
Expand to watch adding the Employees data set in action
Adding Banded List
To display the employee directory, we will use Banded List:
Expand the toolbox using the
Hamburgermenu located on the left side of the toolbar.Drag and drop the
Banded Listitem from the toolbox to the report page area's top-left corner.Switch to the Properties panel in the Property inspector.
Select the
Employeesitem in theData Set Namedrop-down and set theWidthproperty to7.5inso that the banded list occupies the available printable area defined by the report page size and margins.
Expand to watch adding the Banded List in action
Configuring Header Section
By default, the newly added Banded List has the Header section that displays either once at the beginning or at the start of each page, the Details section that appears once per each data record, and the Footer section that shows up either once after all sections complete rendering or on each page.
We use the Header section to display the report title:
Click anywhere inside the banded list to display the band handlers.
Click the first section's handler and set its height to
0.75inin the Properties panel.Turn off the
Repeat On New Pageswitch.Expand the toolbox using the
Hamburgermenu located on the toolbar's left side.Drag and drop the TextBox item from the toolbox to the header section's top-left corner.
Set the following properties for the newly added textbox in the properties panel.
Property | Value |
|---|---|
Value | Employee Directory |
Font Size | 26pt |
Vertical Align | Middle |
Left | 0in |
Top | 0in |
Width | 7.5in |
Height | 0.75in |
Expand to watch configuring the Header section and setting the value of the textbox in action
Adding Data Grouping
Employees in the Contoso database belong to different departments, such as Production, Marketing, etc. Thus, we can group the employee directory by the department name.
Switch to the Data panel in the Property inspector.
Expand the "Employees" data set using the chevron-down icon.
Click anywhere inside the banded list to display the Group editor.
Drag and drop the
DepartmentNamefield to the Group Editor's<New Group>highlighted area.Select the newly appeared
BandedList1_DepartmentName1item in the group editor.Switch to the Properties panel of the Property Inspector.
Set the newly added group name to
DepartmentName.Set the
Page Breakproperty of the group toBetweenso that each group instance starts on the new page.
Expand to watch adding data grouping in action
Configuring Group Header section
The group header displays once per grouping value, thus once per different Department Name. We configure the group header accordingly:
Click anywhere inside the banded list so that it displays the band handlers.
Click the second section's handler and set its height to
0.6inin the Properties panel.Expand the toolbox using the
Hamburgermenu located on the toolbar's left side.Drag and drop the TextBox item from the toolbox to the group header section's top-left corner.
Set the following properties for the newly added textbox in the properties panel.
Property | Value |
|---|---|
Value | {DepartmentName} |
Text Color | #0096aa |
Font Size | 20pt |
Font Weight | Bold |
Vertical Align | Middle |
Left | 0in |
Top | 0in |
Width | 7.5in |
Height | 0.6in |
Note that the group header will display at the top of each page because its Repeat On New Page property is True by default.
Configuring Details section
The details section displays once per data record. We use the Container report item to set the background and border for each details section occurence.
Click anywhere inside the banded list so that it displays the band handlers.
Click the third section's handler and set its height to
2inin the Properties panel.Expand the toolbox using the
Hamburgermenu located on the toolbar's left side.Drag and drop the Container item from the toolbox to the details section's top-left corner.
Set the following properties for the newly added Container in the properties panel.
Property | Value |
|---|---|
Background Color | #f9f9f9 |
Border Style | Solid |
Border Color | #e8e8e8 |
Border Rounding Radius | 4pt |
Left | 0in |
Top | 0in |
Width | 7.5in |
Height | 1.75in |
Next, drag and drop four textboxes from the toolbox into the newly added Container and set their properties as per the following map.
Property | Full Name textbox | Title textbox | Email textbox | Phone textbox |
|---|---|---|---|---|
Value | {FirstName} {MiddleName} {LastName} | {Title} | {EmailAddress} | {Phone} |
Font Size | 14pt | Leave as default | Leave as default | Leave as default |
Vertical Align | Middle | Middle | Middle | Middle |
Text Color | Leave as default | #5e5e5e | #5e5e5e | #5e5e5e |
Left | 0.3in | 0.3in | 0.3in | 0.3in |
Top | 0.3in | 0.85 | 1.15 | 1.45 |
Width | 4in | 4in | 4in | 4in |
Height | 0.5in | 0.3in | 0.3in | 0.3in |
You can now preview the report output and notice that it prints the grouped employee list grouped by the department name.
Using dynamic images
Each employee record includes the AvatarUrl field that is either Null or contains the employee photo's relative URL. We will use the Image report item to either show a picture or the placeholder if the photo is missing.
Go back to the report design.
Expand the toolbox using the
Hamburgermenu.Drag and drop the Image item from the toolbox to the details section closer to its right edge.
In the Properties panel, expand the
Imageeditor using the icon on its right side.Set the
Valueproperty to{IIF(AvatarUrl Is Null, "https://demodata.mescius.io/images/contoso/EmployeePhotos/no-photo.jpg", "https://demodata.mescius.io" + AvatarUrl)}. This Expression is using the IIF function to dynamically identify the picture to display. If theAvatarUrlisNullmeaning that an employee has no photo, theIIFfunction returns the URL of the placeholder. Otherwise, it returns the full URL of the photo.Set the rest of the Image properties as per the following table
Property | Value |
|---|---|
MIME Type | image/jpeg |
Image Sizing | Fit Proportional |
Horizontal Alignment | Center |
Vertical Alignment | Middle |
Left | 5.65in |
Top | 0.15in |
Width | 1.45in |
Height | 1.45in |
You can preview the report output and notice that each employee record now displays the photo or "no image" placeholder.
Adding Report Map
To improve the report reading experience, we add the Report Map that displays the departments' list and allows the report reader to jump from one to another quickly.
Go back to the report design.
Click anywhere inside the banded list so that it displays the group editor.
Select the
DepartmentNameitem in the group editor.In the Properties panel, set the
Labelproperty to{DepartmentName}
Preview the report and open and pin the Report Map panel. It shows all the employee directory departments, and you can switch from one to another to read the employee list of a selected department.
Expand to watch using the report map in action
The final version of report is available at the demo web-site.