
Interactive features
ActiveReportsJS provides several types of interactive features to supply your reports with for a better user experience.
Action property
TextBox, Image, Chart Plots, Table Rows, Banded List sections, and List sections have the Action property that determines what happens if a report reader clicks a report item, chart plot's element, any element within a table row, or within a space occupied by a List or BandedList section at preview time.
There are four types of interactive actions.
Apply parameters
The Apply Parameters action sets the values of one or more Report Parameters and re-renders the report with these updated values. You can configure the Apply Parameters action using the following properties:
Parameters Collection: A list of items defining how parameter values should change. Each item includes:
Parameter: The specific parameter to modify.
Setter type: The method used to change the parameter's value:
Set– Sets the parameter to a specific value.Reset– Reverts the parameter to its default value.Toggle– Adds or removes the specified value from amulti-valueparameter.
Value: The expression specifying the new parameter value (this is not applicable for the
Resetsetter type).
Target Bookmark: An optional property that instructs the report viewer to automatically jump to a specified bookmark after the parameters are applied and the report re-renders.
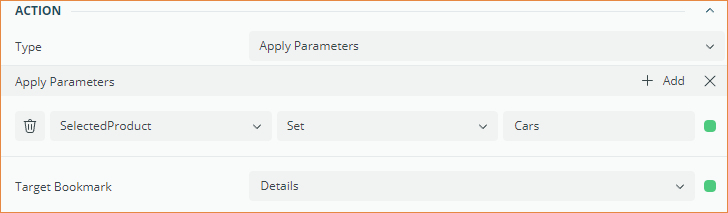
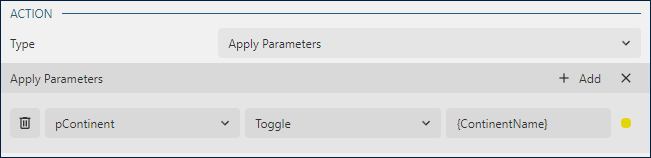
A common use case for this feature is implementing runtime filters. For example, the Sales Dashboard demo features Year List and Continent List controls, which a report reader can use to review sales statistics for a specific year and across one or more regions. The Apply Parameters action of the Continent List is configured to Toggle the Continent Name (which the reader clicks) within the multi-value pContinent parameter:
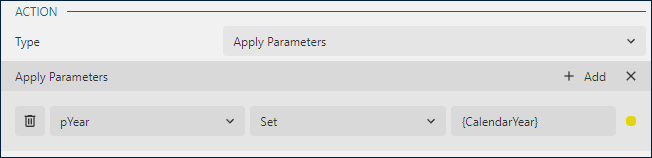
The action for the Year List is configured to Set the single-value pYear parameter to the specific year the reader clicks:
The Data Regions in this report are configured to filter out data according to these parameters:
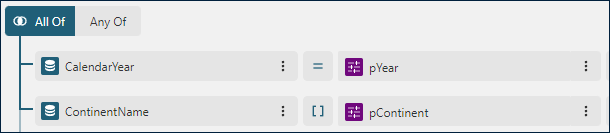
Thus, when a report reader clicks on a year or toggles a continent, the report re-renders with the new parameter values, and the data regions are filtered accordingly. If a Target Bookmark is also defined, the viewer will seamlessly navigate to that specific section of the report as soon as the new parameters are applied.
Jump to Report
The Jump to Report action opens the specified report in the viewer. You could use this feature to create Drill-Through Reports. The configuration includes the following properties.
Jump to Report- the expression that specifies the report name to open when a reader clicks a report itemParameters- the collection of parameter values to pass into the report above.
Jump to Bookmark
The Jump to Bookmark action brings the report item with the specified Bookmark into focus. The Bookmarks demo uses this feature to display the interactive summary table on the first page. If you click the month name, the viewer switches to the page that shows the detail table for the specified month.
Jump to URL
The Jump to URL action opens the specified URL in the new window or new tab, depending on the browser settings.
Report Map
All the report items and groups, such as a Table Group in ActiveReportsJS have the Label property. Also, a TextBox report has the HeadingLevel that takes integer values starting from 1.
Together labels and values of textboxes with HeadingLevel generate the Report Mapdisplayed on the report viewer sidebar. The hierarchy of items in the report map is defined by one of the following conditions.
TextBoxes with
HeadingLevelis set1are on the root level of hierarchy. TextBoxes withHeadingLevelis set to2are on the next level and so on. The Catalog sample has theHeadingLevel= 1 for the textbox located in the Table Group Header. The generated labels are displayed in both of the report map and Table of Contents.Parent and child groups that have a non-empty
Labelproperty organically generate the hierarchy. You can find an example of this approach in the Nested Lists demo.
The Source property in the Document Map section of Report properties determines which items are included in the report map:
Labels- only labels are included. This is the default value.Headings- only textbox values withHeadingLevel>= 1 are included.All- both labels and textbox values are included. This should be the last resort option for rare scenarios.None- report map is not generated.Also, the
Numbering Styleproperty of a report determines the marker of an item in the report map and Table of Contents.