| Quick Start Guide | |
|---|---|
| Tutorial Concept |
Learn how to create a Pivot Table in a WPF spreadsheet application using Spread.NET and the Spread.NET WPF Pivot Table engine. |
| What You Will Need |
|
| Controls Referenced | |
Imagine working with a large sales dataset that contains information such as order date, region, city, product category, product name, and quantity sold. Analyzing this type of raw data manually can quickly become difficult as the dataset grows.
Pivot Tables provide a powerful way to transform raw spreadsheet data into interactive summaries and analytical reports. Instead of reviewing individual rows one by one, users can group, filter, and aggregate information dynamically to identify trends and compare sales performance across different regions, cities, categories, and products.
In this tutorial, we will use Spread.NET WPF to create an Excel-like Pivot Table report directly inside a WPF spreadsheet application. The final result will include grouped row and column fields, filter functionality, summarized quantity totals, and expandable drill indicators for interactive data analysis.
Steps to Create a Pivot Table in a WPF App
- Create a New WPF Project
- Add Spread.NET WPF References
- Add the GcSpreadSheet Control
- Add the Required Namespaces
- Create the Pivot Table Sample
- Understanding the WPF Pivot Table Logic
- Run the Application
- Conclusion
Download a Free 30-Day Trial of this WPF Spreadsheet Component to Try for Yourself!
Create a New WPF Project
The first step is to create a standard WPF desktop application. This project will host the Spread.NET WPF spreadsheet control and display both the source data and the generated Pivot Table.
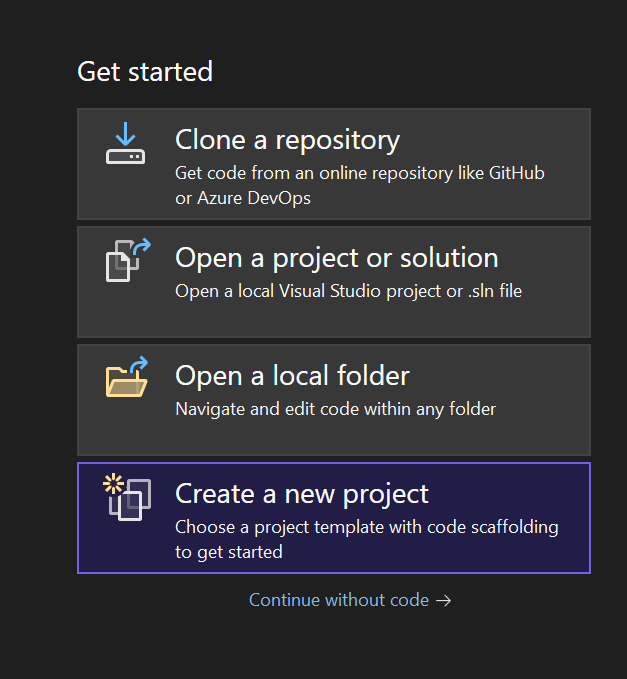
- Open Visual Studio.
- Select Create a new project.
- Search for WPF Application.
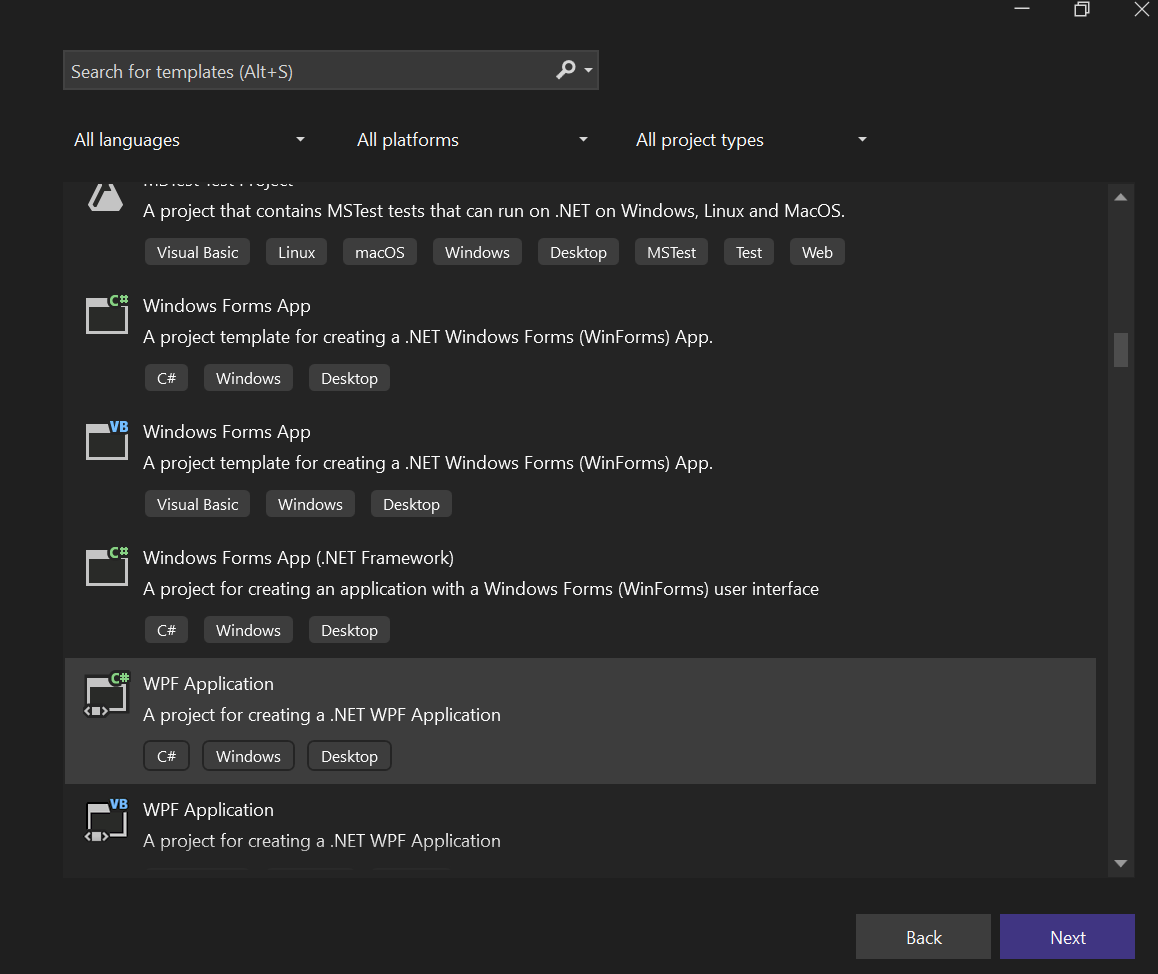
- Choose the WPF project template for C#.
- Click Next.
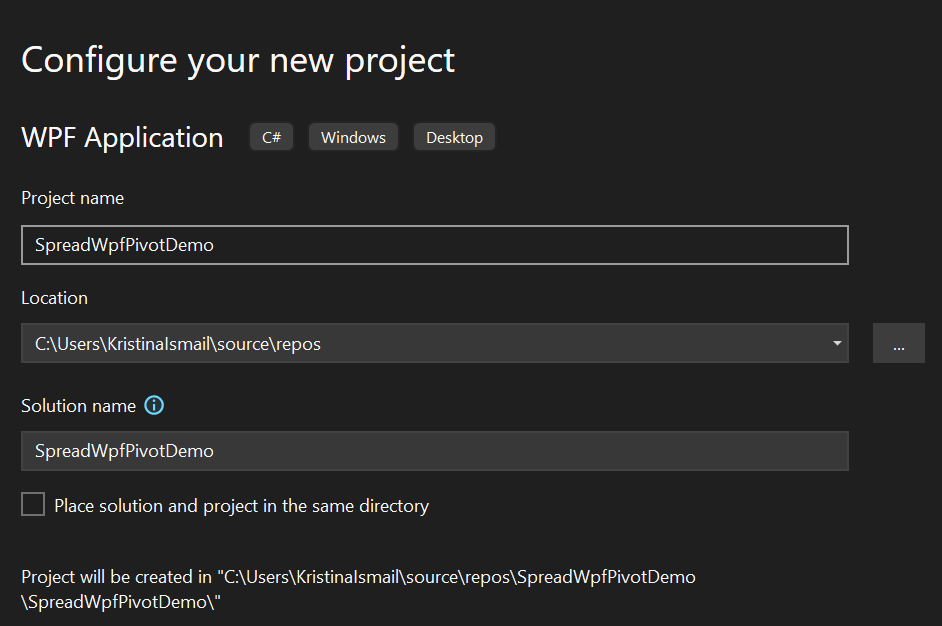
- Name the project: SpreadWpfPivotDemo
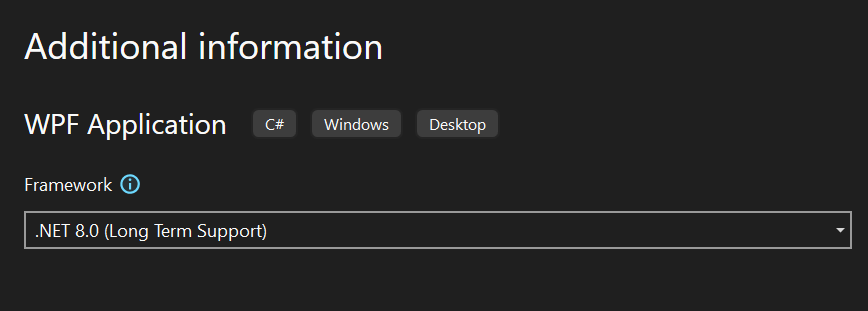
- Select the .NET framework version (.NET 8 recommended), and then click Create.
After the project is created, Visual Studio will generate the default WPF files, including MainWindow.xaml and MainWindow.xaml.cs. These are the two files we will update in this tutorial.
Add Spread.NET WPF References
Next, install the required Spread.NET WPF NuGet package. This package provides the GcSpreadSheet control, workbook and worksheet APIs, and the Pivot Table functionality used throughout this tutorial.
In Solution Explorer, right-click the project name and select Manage NuGet Packages.
Open the Browse tab and search for:
MESCIUS.Spread.WPFAfter the installation is complete, the required Spread.NET WPF assemblies will be added automatically to the project references. These assemblies enable you to use the GcSpreadSheet control in XAML and access the workbook, worksheet, and Pivot Table APIs from the C# code-behind.

Add the GcSpreadSheet Control
Next, add the Spread.NET WPF spreadsheet control to the main application window. The GcSpreadSheet control will be used to display both the worksheet data and the generated Pivot Table report.
Open MainWindow.xaml and replace the default XAML with the following code:
<Window x:Class="SpreadWpfPivotDemo.MainWindow"
xmlns="http://schemas.microsoft.com/winfx/2006/xaml/presentation"
xmlns:x="http://schemas.microsoft.com/winfx/2006/xaml"
xmlns:gc="clr-namespace:GrapeCity.Wpf.SpreadSheet;assembly=GrapeCity.Wpf.SpreadSheet"
Title="Spread.NET WPF Pivot Table Demo"
Height="700"
Width="1200">
 <Grid>
 <gc:GcSpreadSheet x:Name="gcSpreadSheet1"
Margin="10"/>
 </Grid>
</Window>
The xmlns:gc namespace reference maps the Spread.NET WPF assembly, allowing the GcSpreadSheet control to be used directly inside the XAML layout.
The spreadsheet control is assigned the name gcSpreadSheet1, which makes it accessible from the C# code-behind file where the workbook and Pivot Table logic will be implemented.
A simple Grid layout container is used so the spreadsheet control automatically fills the application window while maintaining a small margin around the edges.

Add the Required Namespaces
Next, open MainWindow.xaml.cs. This file will contain the C# logic used to load the worksheet data, create the Pivot Cache, and generate the Pivot Table.
At the top of the file, add the following namespaces:
using System;
using System.Windows;
using GrapeCity.Spreadsheet;
using GrapeCity.Spreadsheet.PivotTables;
The GrapeCity.Spreadsheet namespace provides access to the core Spread.NET workbook and worksheet object model, including interfaces such as IWorkbook and IWorksheet.
The GrapeCity.Spreadsheet.PivotTables namespace contains the APIs required for creating and configuring Pivot Tables, including IPivotCache, IPivotTable, IPivotFields, field orientations, layout settings, and data summarization options.
These namespaces provide all the functionality needed to build and configure the Pivot Table report used throughout this tutorial.
Create the Pivot Table Sample
Now we can implement the complete Pivot Table workflow. The following code loads sample sales data into the worksheet, creates a Pivot Cache from the source data range, generates a Pivot Table report, and configures the Pivot Table fields and layout settings.
Open MainWindow.xaml.cs and replace the existing class implementation with the following code:
using System;
IWorksheet sheet = workbook.ActiveSheet;

sheet.Name = "Sheet1";

workbook.WorkbookSet.BeginUpdate();

try
 {
sheet.SetValue(0, 0, new object[,]
 {
 { "OrderDate", "Region", "City", "Category", "Product", "Quantity" },
 { "2025-07-01", "East", "Jersey", "Breads", "Bakery", 1120 },
 { "2025-07-01", "East", "Jersey", "Breads", "Cookie", 563 },
 { "2025-07-02", "East", "Washington, DC", "Breads", "Bakery", 1281 },
 { "2025-07-02", "East", "Washington, DC", "Breads", "Cookie", 546 },
 { "2025-07-01", "East", "Jersey", "Beverages", "Coffee", 326 },
 { "2025-07-02", "East", "Washington, DC", "Beverages", "Coffee", 205 },
 { "2025-07-02", "East", "Washington, DC", "Beverages", "Juice", 186 },
 { "2025-07-01", "West", "San Francisco", "Breads", "Bakery", 1262 },
 { "2025-07-01", "West", "San Francisco", "Breads", "Cookie", 349 },
 { "2025-07-01", "West", "Seattle", "Breads", "Bakery", 524 },
 { "2025-07-01", "West", "Seattle", "Breads", "Cookie", 196 },
 { "2025-07-01", "West", "San Francisco", "Beverages", "Coffee", 363 },
 { "2025-07-01", "West", "Seattle", "Beverages", "Coffee", 100 },
 { "2025-07-02", "East", "Jersey", "Beverages", "Juice", 120 },
 { "2025-07-02", "West", "San Francisco", "Breads", "Bakery", 350 },
 { "2025-07-02", "West", "Seattle", "Beverages", "Tea", 180 },
 { "2025-07-02", "East", "Jersey", "Breads", "Cookie", 75 },
 { "2025-07-03", "West", "San Francisco", "Beverages", "Juice", 210 },
 { "2025-07-03", "East", "Boston", "Breads", "Bakery", 420 }
 });
sheet.Columns[0].AutoFit();
sheet.Columns[1].AutoFit();
sheet.Columns[2].AutoFit();
sheet.Columns[3].AutoFit();
sheet.Columns[4].AutoFit();
sheet.Columns[5].AutoFit();
IPivotCache pvCache = workbook.PivotCaches.Create("Sheet1!A1:F20");
IPivotTable pvTable = pvCache.CreatePivotTable(sheet.Cells["I1"]);
IPivotFields pvFields = pvTable.PivotFields;
pvTable.AddDataField(
pvFields["Quantity"],
"Sum of quantity",
ConsolidationFunction.Sum
 );
pvFields["Region"].Orientation = PivotFieldOrientation.Row;
pvFields["City"].Orientation = PivotFieldOrientation.Row;
pvFields["Category"].Orientation = PivotFieldOrientation.Column;
pvFields["Product"].Orientation = PivotFieldOrientation.Column;
pvFields["OrderDate"].Orientation = PivotFieldOrientation.Page;
pvTable.RowAxisLayout = LayoutRowType.Tabular;
pvTable.RowGrand = true;
pvTable.ColumnGrand = true;
pvTable.ShowDrillIndicators = true;
 }
finally
 {
workbook.WorkbookSet.EndUpdate();
 }
 }
 }
}
For tutorial purposes, the complete Pivot Table workflow is implemented inside a single method to make the sample easier to read and follow.
Understanding the WPF Pivot Table Logic
Step 1: Add Source Data
The SetValue() method is used to insert a two-dimensional array directly into the worksheet. This dataset becomes the source data for the Pivot Table report and contains information such as order date, region, city, category, product, and quantity.
sheet.SetValue(0, 0, new object[,] { ... });
Step 2:Create the Pivot Cache
A Pivot Cache is created from the worksheet data range. The Pivot Cache stores and manages the source data used by the Pivot Table and helps improve reporting performance when summarizing and grouping data.
IPivotCache pvCache = workbook.PivotCaches.Create("Sheet1!A1:F20");Step 3: Create the Pivot Table
Next, a Pivot Table report is generated directly inside the worksheet starting at cell I1.
IPivotTable pvTable = pvCache.CreatePivotTable(sheet.Cells["I1"]);This creates the Pivot Table structure that will later be configured with row, column, filter, and data fields.
Step 4: Configure Pivot Fields
Pivot Fields determine how the data is grouped, organized, filtered, and displayed inside the report.
pvFields["Region"].Orientation = PivotFieldOrientation.Row;
pvFields["City"].Orientation = PivotFieldOrientation.Row;
The Region and City fields are configured as row fields so the data is grouped vertically.
pvFields["Category"].Orientation = PivotFieldOrientation.Column;
pvFields["Product"].Orientation = PivotFieldOrientation.Column;
The Category and Product fields are configured as column fields to organize the summarized data horizontally across the report.
pvFields["OrderDate"].Orientation = PivotFieldOrientation.Page;The OrderDate field is configured as a page/filter field, allowing the report to be filtered dynamically by date.
Step 5: Add a Data Field
The AddDataField() method is used to create the summarized values displayed inside the Pivot Table.
pvTable.AddDataField(
pvFields["Quantity"],
"Sum of quantity",
ConsolidationFunction.Sum
);
In this example, the Quantity field is aggregated using the Sum consolidation function to calculate the total quantity sold across different regions, cities, categories, and products.
Step 6: Configure the Layout
The final step is configuring the Pivot Table layout and display settings.
pvTable.RowAxisLayout = LayoutRowType.Tabular;
pvTable.RowGrand = true;
pvTable.ColumnGrand = true;
pvTable.ShowDrillIndicators = true;
These settings configure the Pivot Table to use a Tabular layout, display both row and column grand totals, and enable expand/collapse drill indicators for easier navigation and analysis of grouped data.
Run the Application
After completing the implementation, set SpreadWpfPivotDemo as the startup project and run the application from Visual Studio.
The application will display the worksheet containing the source sales data along with a fully functional Pivot Table report that includes grouped row and column fields, summarized quantity totals, filtering functionality, and expandable drill indicators for interactive data analysis.

Conclusion
In this tutorial, we created a Pivot Table inside a WPF spreadsheet application using Spread.NET WPF and the Pivot Table APIs. We covered how to create a WPF application, add source data to a worksheet, create a Pivot Cache, generate a Pivot Table report, configure row, column, filter, and data fields, and apply layout and drill indicator settings.
With Spread.NET WPF, developers can build powerful Excel-like reporting and analytical experiences directly inside desktop applications while maintaining high performance and flexibility. The sample application can be further enhanced by adding Pivot Table styling, filtering and sorting functionality, calculated fields, grouping support, custom layouts, and interactive dashboard features.
Happy Coding!
Download a Free 30-Day Trial of this WPF Spreadsheet Component to Try for Yourself!
Tags:
Related Blogs
Try Our .NET Spreadsheet Components
Spread.NET Resources
