How to Show Cell Selection Statistics in a WinForms Datagrid
FlexGrid, the DataGrid for .Net control, is a powerful, full-featured grid that provides all the basic and advanced features such as outline trees, sorting, cell merging, masked editing, translated combo, image lists, and automatic data aggregation. This control provides a robust API and extensive design-time support, giving end-users a familiar Excel-like experience.
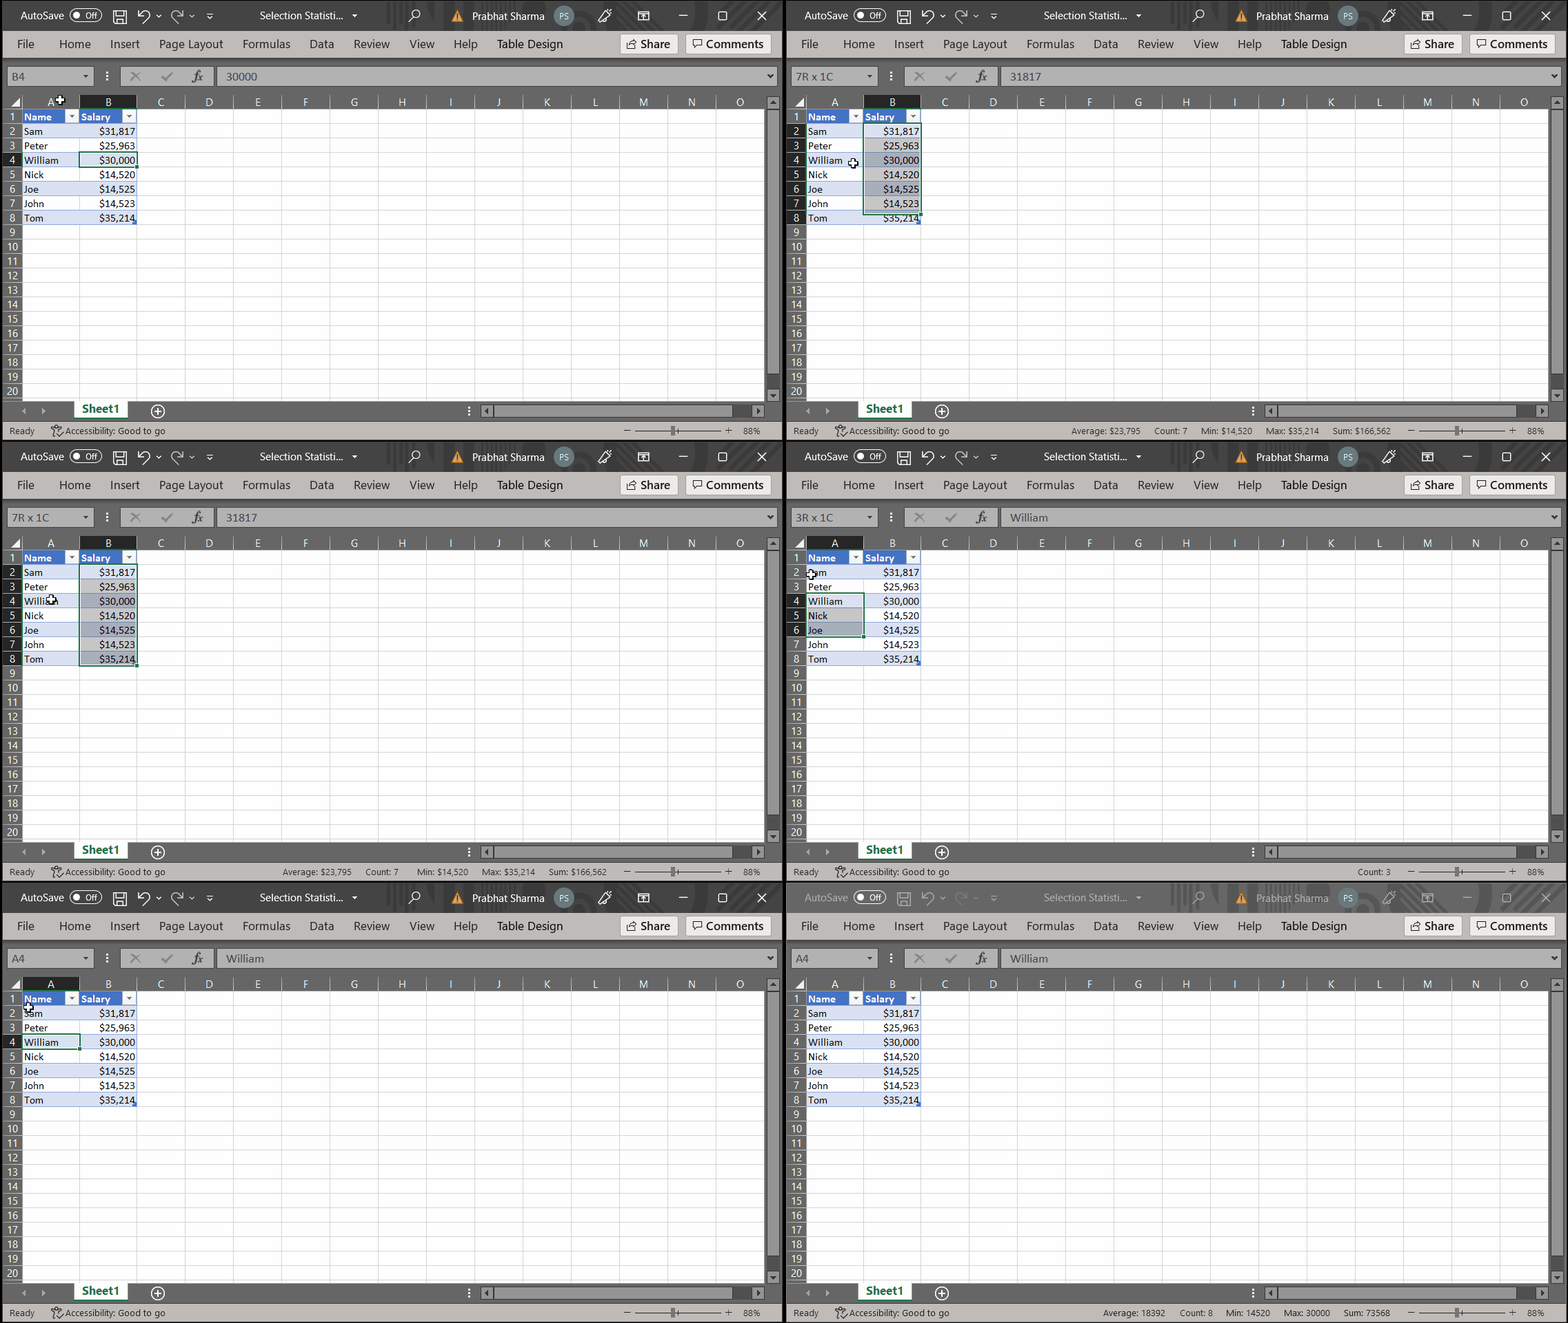
When displaying substantial amounts of computational data in the grid, one might require seeing the statistics like Sum, Maximum, Minimum, Count, and Average at runtime, same as Microsoft Excel offer in the status bar. The summary values are updated whenever a different range of cells is selected, as shown in the MS Excel GIF below:

The same is achieved in FlexGrid, by combining Microsoft's ToolStrip with FlexGrid's Aggregate function.
To obtain this capability using FlexGrid in .NET 6.0, divide the implementation into the following steps:
- Create a new.NET 6.0 Windows Forms application
- Assign Data Source to the FlexGrid
- Create and handle UpdateStatistics method to show Selection Statistics
Create a New .NET 6.0 Windows Forms Application
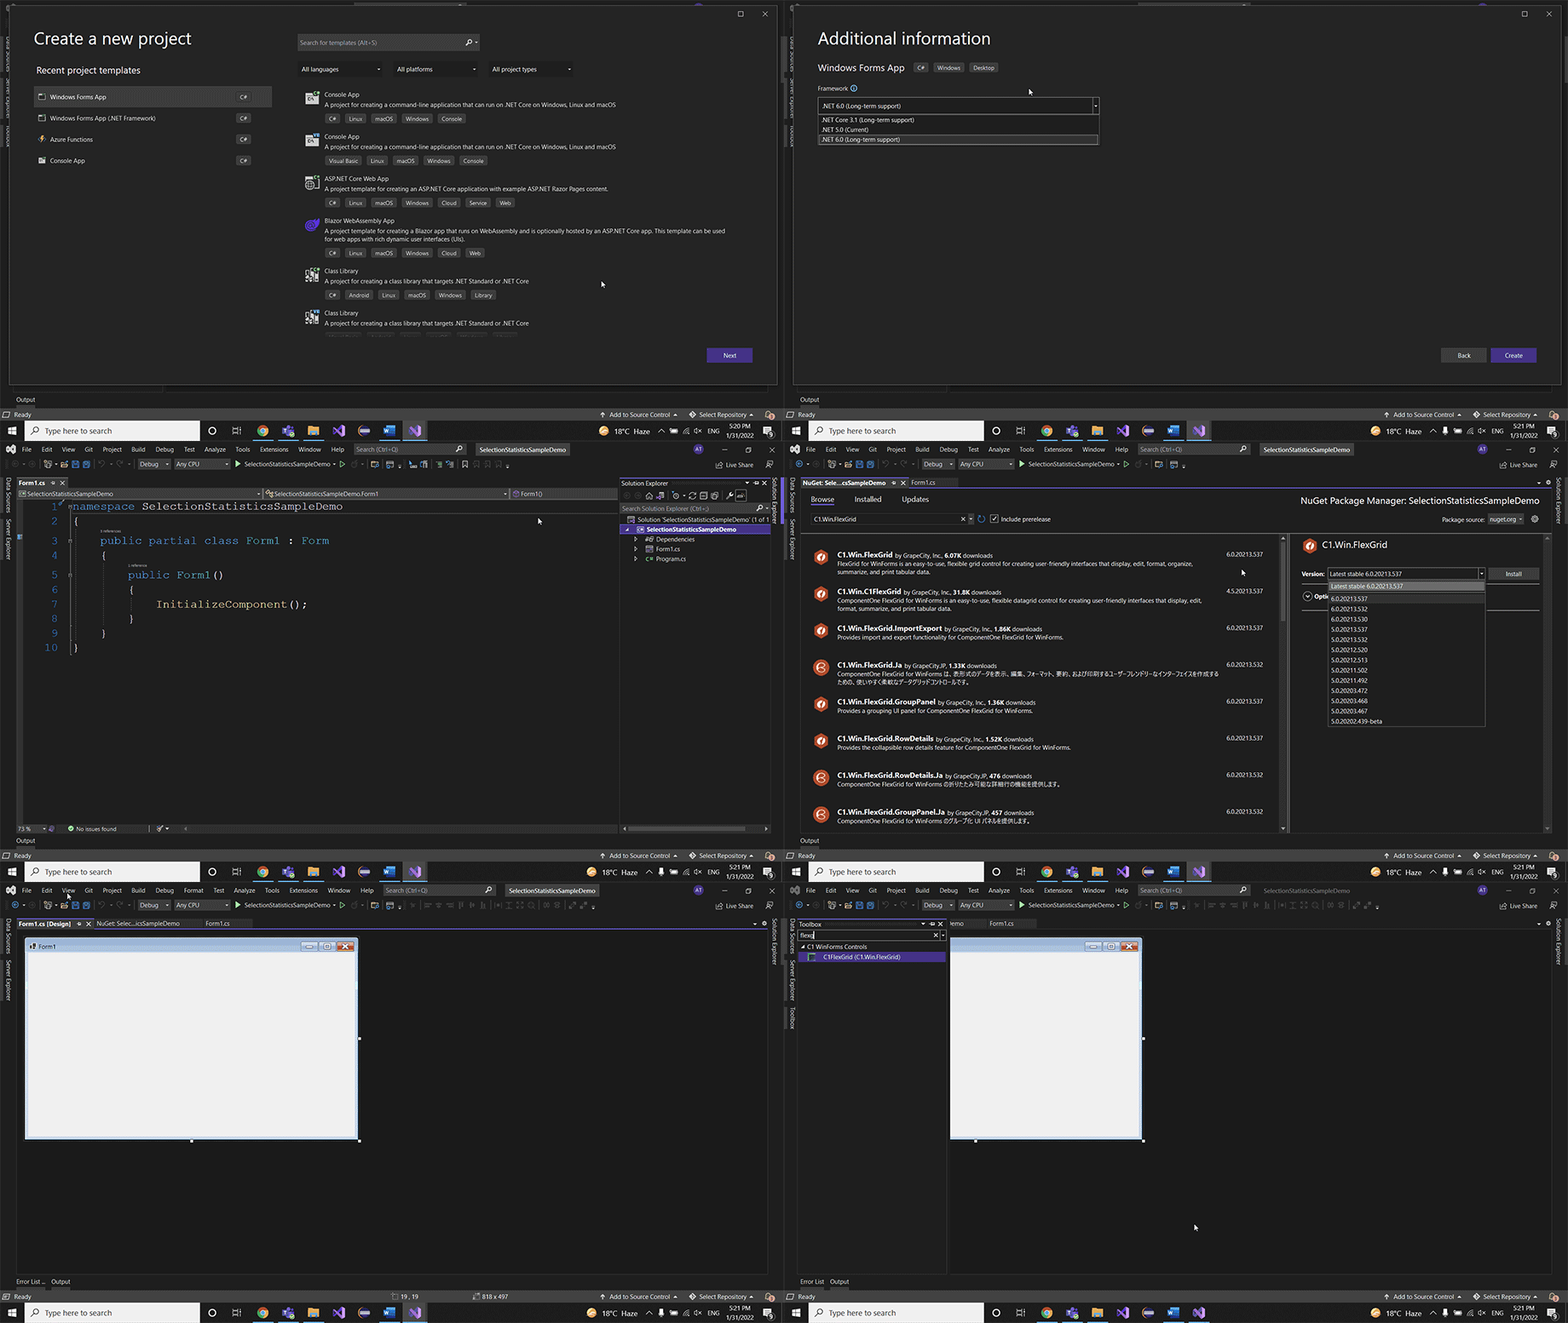
Create a new Windows Forms .NET 6.0 application using Visual Studio 2022 and add the FlexGrid NuGet package to get the FlexGrid control in the ToolBox.

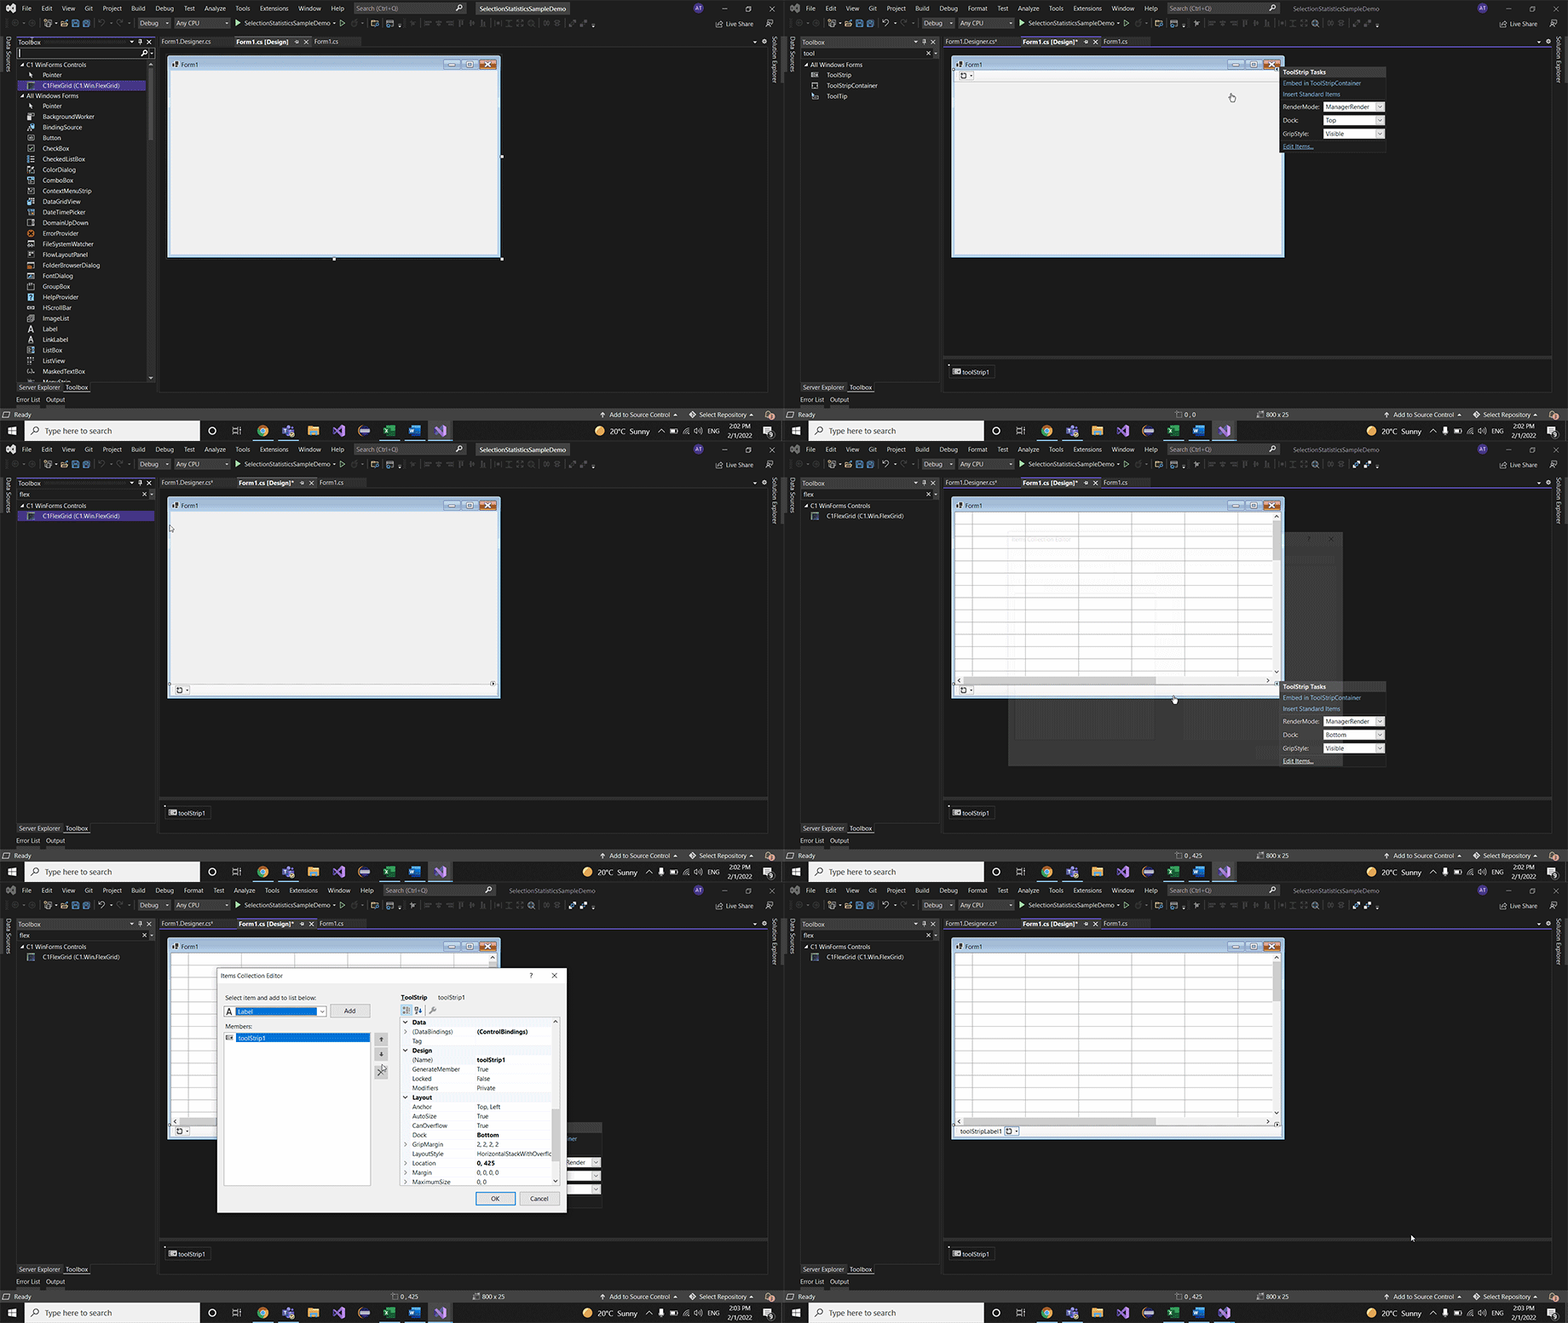
Drop the FlexGrid control on the Form to display data and the ToolStrip control with ToolStripLabel as an item to display statistics.

Assign Data Source to the FlexGrid
After finalizing the layout, attach the data to the grid using the DataSource property. This blog uses a custom class DataSource.cs to receive Order details data from the NORTHWIND database. This database is located at the following location in our system:
C:\Users\UserName\Documents\ComponentOne Samples\Common
The GetRows function of the custom class is used to retrieve the data using the below-given query string to assign it to the DataSource property of FlexGrid.
var sql = @"SELECT Distinct Orders.[OrderID], Orders.OrderDate, Shippers.CompanyName, Customers.Country as Country, [FirstName] + ' ' + [LastName] AS Salesperson, Products.ProductName AS Product, [Order Details].UnitPrice as UnitPrice, [Order Details].Quantity, [Order Details].Discount, ([Order Details].[UnitPrice]*[Quantity]*(1-[Discount])/100)*100 as ExtendedPrice FROM Shippers INNER JOIN (Products INNER JOIN ((Employees INNER JOIN (Customers INNER JOIN Orders ON Customers.CustomerID = Orders.CustomerID) ON Employees.EmployeeID = Orders.EmployeeID) INNER JOIN [Order Details] ON Orders.OrderID = [Order Details].OrderID) ON Products.ProductID = [Order Details].ProductID) ON Shippers.ShipperID = Orders.ShipVia;";

SelectionStatisticsGrid.DataSource = DataSource.GetRows(sql);
To organize the data, you can group the data based on the CompanyName and Country columns, using the following code:
var groups = new List<GroupDescription>();
var group1 = new GroupDescription("CompanyName", ListSortDirection.Descending, true);
var group2 = new GroupDescription("Country", ListSortDirection.Descending, true);
groups.Add(group1);
groups.Add(group2);
Create and Handle UpdateStatistics Method to Show Selection Statistics
The next step is to calculate the Statistics values, which will be done using FlexGrid's Aggregate method, which calculates the various Aggregate Statistics of the currently selected cells based on the AggregateEnum parameter.
You need to call the Aggregate method multiple times with different AggregateEnum values such as Average, Count, Min, Max, and Sum to display various statistics. Finally, assign it to the ToolStripLabel by formatting it in a string object.
The statistics result may only be necessary when the selection is more than one cell, so you should also check this condition.
After considering all the above-given factors, construct a UpdateStatistics method that looks like this:
private void UpdateStatistics()
{
var text = string.Empty;
if (!SelectionStatisticsGrid.Selection.IsSingleCell)
{
//Generate the Statistics Data to show into ToolStrip
text = $"Average: {SelectionStatisticsGrid.Aggregate(AggregateEnum.Average):F2}  " +
$"    Count: {SelectionStatisticsGrid.Aggregate(AggregateEnum.Count)}  " +
$"    Minimum: {SelectionStatisticsGrid.Aggregate(AggregateEnum.Min)}  "+
$"    Maximum: {SelectionStatisticsGrid.Aggregate(AggregateEnum.Max)}  "+
$"    Summary: {SelectionStatisticsGrid.Aggregate(AggregateEnum.Sum):F2}"; Page layout
}
selectionStatisticsLabel.Text = text;
}
Handle the FlexGrid's SelChange event, which fires whenever a new selection is made. Call the UpdateStatistics method inside it to show the Statistics on the ToolStripLabel whenever the end-user selects multiple cells in the grid.
SelectionStatisticsGrid.SelChange += C1FlexGrid1_SelChange;
private void C1FlexGrid1_SelChange(object? sender, EventArgs e)
{
UpdateStatistics();
}
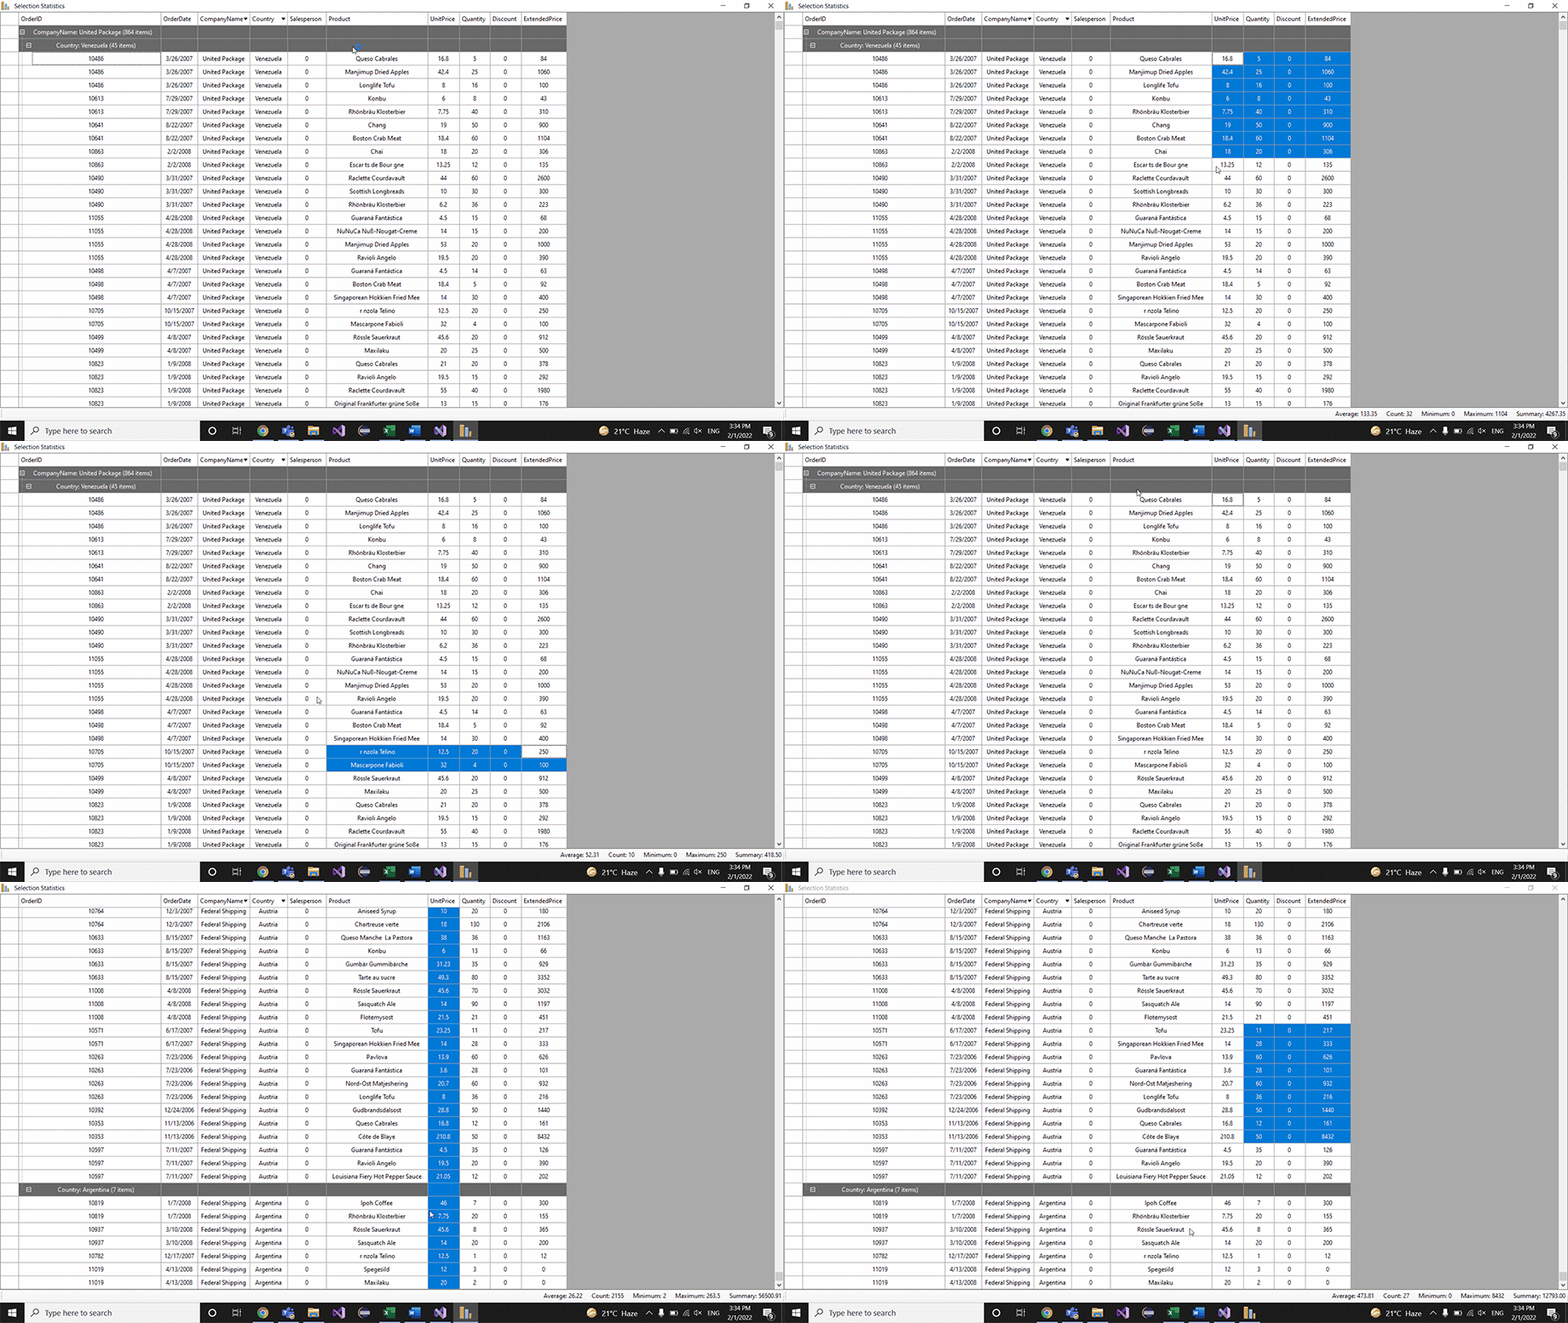
If you have followed all of the above steps correctly, the completed application will work like the GIF below:

If you have the C1 WinForms suite installed, the sample can be found in the following place on your system.
-
.NET 6.0 controls: C:\Users\UserName\Documents\ComponentOne Samples\WinForms\v6.0\FlexGrid\CS\FlexGridExplorer
-
.NET 4.5.2 controls: C:\Users\UserName\Documents\ComponentOne Samples\WinForms\v4.5.2\FlexGrid\CS\SelectionStatistics
You can also download it from the Github links.
NET 6.0 controls | .NET 4.5.2 controls
Try it out and leave your feedback or questions in the comments section.
Happy Coding!
