ActiveReports.NET v19 Has Released
Hello developers! We’re happy to announce that ActiveReports.NET v19.0 is now live! This year, we have a great selection of exciting new features, such as a significantly upgraded report wizard, a complete overhaul of the chart control, and, of course, .NET 9 support. Check out the details of this release in the sections below:
- .NET 9 Support
- Report Wizard Phase Two
- Optimized Report Item and Dataset Workflows
- Chart Control Overhaul
- Custom TextBox and CheckBox CSS Styles
- Public API for Customizing JS Report Viewer and Web Designer Themes
Ready to check it out? Download ActiveReports.NET Today!
.NET 9 Support
As always, staying up to date with the latest versions of .NET is one of our paramount priorities. Thus, ActiveReports.NET v19 introduces support for .NET 9. Developers upgrading existing applications or building new projects on .NET 9 can continue using ActiveReports without compatibility concerns. This update allows seamless integration with the latest advancements in .NET while maintaining the reliability and functionality of ActiveReports.
Report Wizard Phase Two
The Report Wizard was added last year in v18. Now, v19 introduces phase two of the Report Wizard, further simplifying the report creation process with additional configuration options. Previously, the wizard only supported data binding. In this release, the following new capabilities have been added:
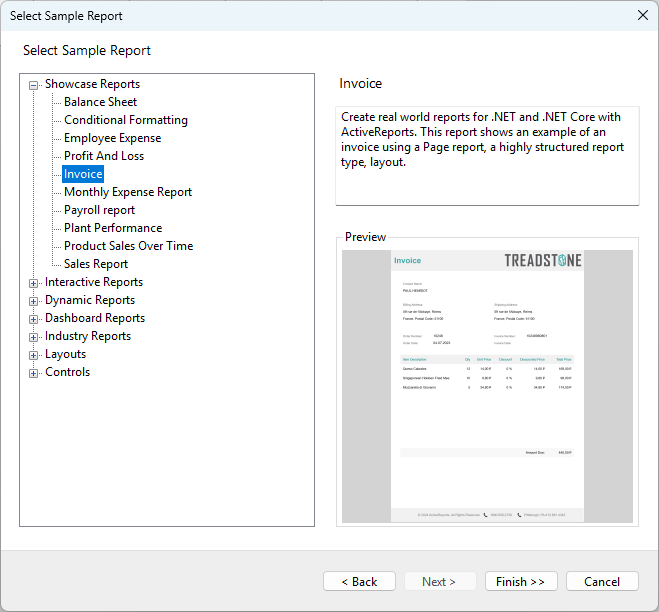
- Use Sample Reports as a Starting Point – Select from built-in product samples to accelerate development.
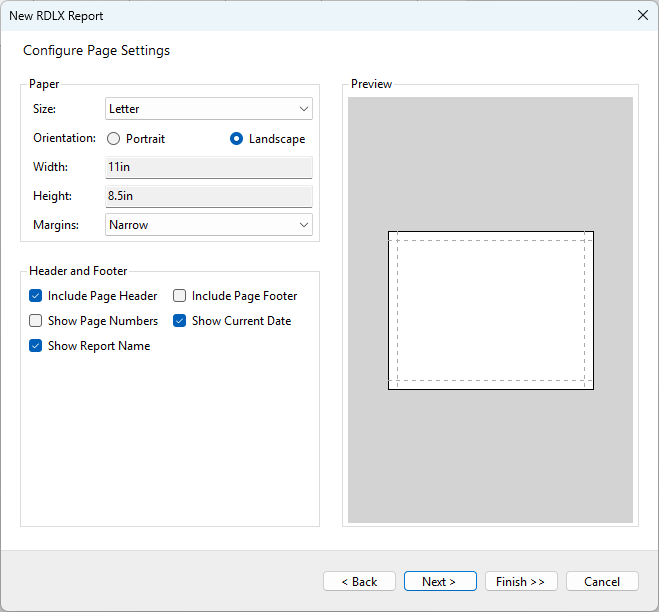
- Define Page Settings – Configure page size, orientation, and margins at the start.
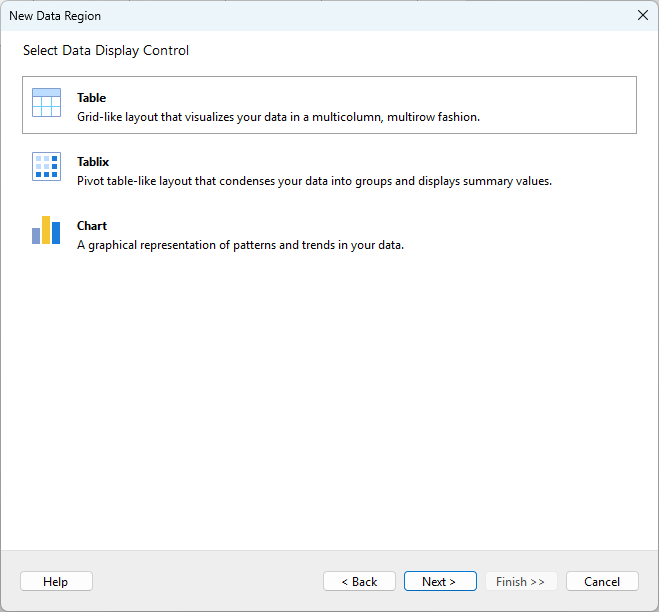
- Set Up Data Visualizations – Choose and configure Tables, Tablices, and Charts directly within the wizard.
- Customize Report Colors – Apply predefined or custom color schemes for a consistent report appearance.
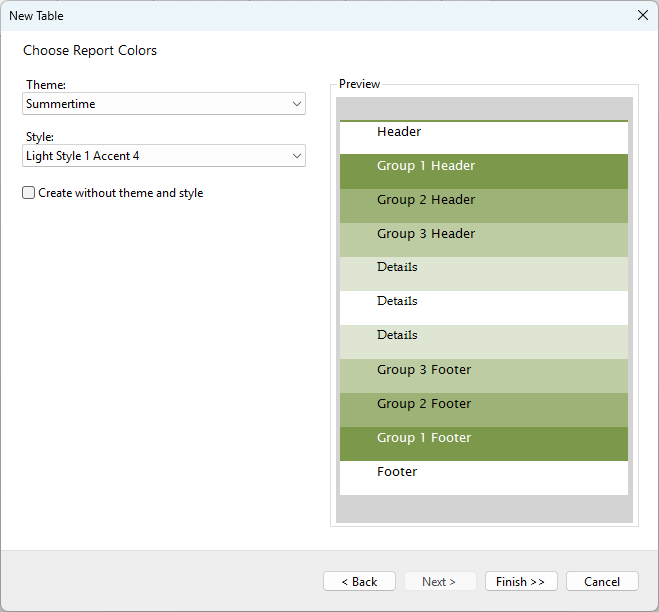
These enhancements make it easier to create professional reports in just a few clicks.
Optimized Report Item and Dataset Workflows
ActiveReports.NET v19 brings several improvements to the report designer, enhancing the user experience when working with report items and datasets. These updates streamline report creation by automating common workflows and providing quick access to key functionalities.
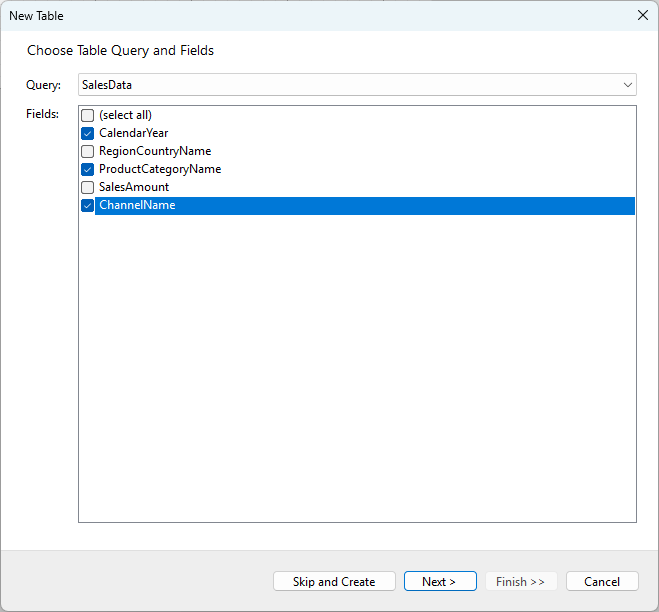
- Automatic Wizard Invocation for Report Items – To simplify report configuration, the following wizards are now triggered automatically when corresponding report items are dragged onto the design surface unless disabled in the configuration file:
- Table Wizard – Invoked when a Table report item is added.
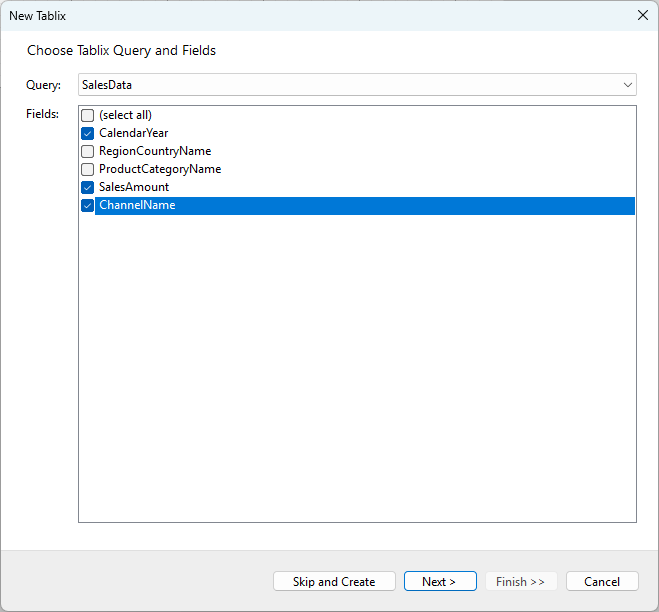
- Tablix Wizard – Invoked when a Tablix report item is added.
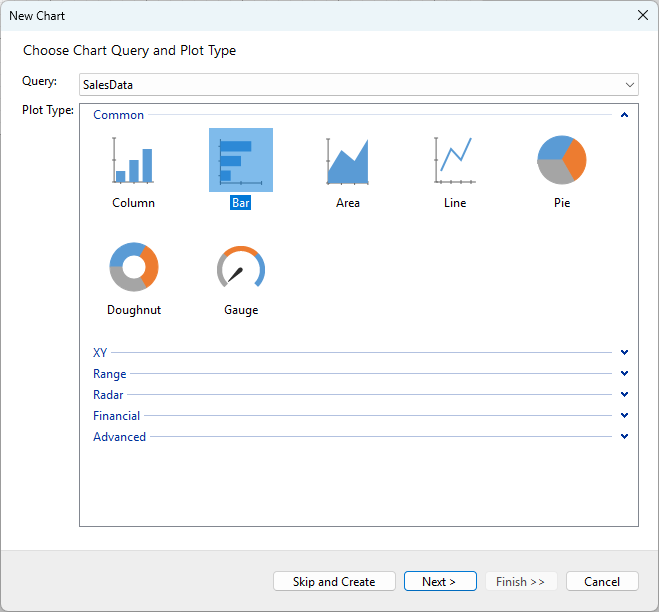
- Chart Wizard – Invoked when a Chart report item is added.
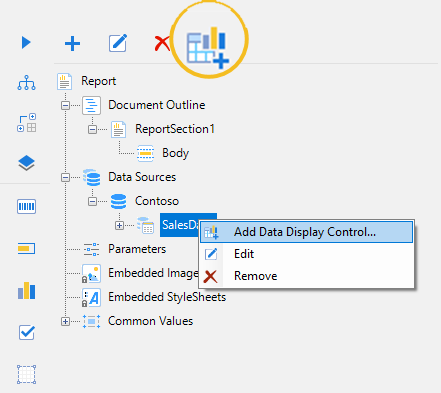
- Improved Dataset and Data Region Management – To provide more control over dataset usage, new actions have been added:
- "Add Data Display Control..." – A new option in the dataset context menu that launches the Adding Data Region page.
- "Add Data Region..." – A button in the data panel's top bar, active when a dataset is selected, opens the Adding Data Region dialog.
- Dataset Drag-and-Drop Support – When a dataset is dragged onto the report body, the Adding Data Region dialog is automatically invoked, allowing users to select the appropriate data region.
These enhancements improve design-time efficiency, making report creation more intuitive and reducing manual setup steps.
Chart Control Overhaul
For ActiveReports.NET v19, we have completely revised the Chart report item from the ground up, offering greater flexibility and configurability across all aspects of chart design. From data binding to legend customization, the new chart model provides more dynamic options to better suit various reporting needs.
- Enhanced Configurability – Every aspect of the chart, including data binding, axis settings, labels, and legend items, is now more customizable by using dynamic expressions.
- Seamless Migration – Existing charts are automatically converted to the new model when an older report is opened in the designer, ensuring a smooth transition without manual adjustments.
This update simplifies chart configuration while providing more control over data visualization, making it easier to create clear and insightful reports.
 |
 |
Custom TextBox and CheckBox CSS Styles
In ActiveReports.NET v19, we’ve added the CustomCSSClasses property for TextBox and CheckBox report items, allowing you to apply custom CSS class names when rendering reports in the JS Report Viewer. This feature provides greater flexibility in styling report elements, enabling custom appearances such as making a TextBox look like a button.
- Flexible Styling – Assign one or more CSS classes to TextBox and CheckBox elements using the CustomCSSClasses property.
- Predefined Styles – The JS Report Viewer deliverables now include the
jsViewer.custom.styles.cssfile, which provides built-in styles such as: ar-button– Styles elements to resemble buttons.ar-button-pressed– Represents a pressed button state.- Custom Styling – You can apply predefined styles or define custom styles to match report design requirements.
- Dynamic Conditional Styling – The CustomCSSClasses property supports dynamic expressions, allowing styles to be applied conditionally based on report data or parameter values.
This enhancement allows for more visually appealing and interactive reports, giving you greater control over how report elements are presented.

Public API for Customizing JS Report Viewer and Web Designer Themes
Last but not least, ActiveReports.NET v19 expands its APIs with a new public API that allows you to easily customize the appearance of the browser-based Web Report Viewer and Designer. This enhancement provides flexibility in theming, enabling you to create a fully customized look and feel for reporting applications.
- Full UI Customization – Modify the styling of the JS Report Viewer and Web Report Designer to match your application's design.
- Theme Creation – Quickly create a new theme from scratch or customize an existing one based on predefined color schemes.
- Theme Selector in Toolbar – The JS Report Viewer now includes a theme selector in the toolbar, allowing report readers to switch themes dynamically.
- Public API for Theme Management – You can use the API to:
- Enable or disable the theme selector in the toolbar.
- Set the default theme for the viewer.
- Define the list of available themes, including custom themes.
This feature simplifies UI customization, ensuring a consistent and branded experience across reporting solutions while giving end users control over their preferred theme.

Ready to try it out? Download ActiveReports.NET Today!
With the release of ActiveReports.NET v19, we continue our commitment to empowering developers with powerful, flexible, and user-friendly reporting solutions. From .NET 9 support and an enhanced Report Wizard to a completely revamped Chart control and advanced customization options, this version introduces significant improvements that streamline report creation and provide greater control over data visualization. Whether you're designing reports, optimizing workflows, or customizing the UI, ActiveReports.NET v19 delivers the tools you need to build professional-grade reporting solutions with ease. We’re excited for you to explore these new features—upgrade today and experience the latest in reporting innovation!
Tags:
Related Blogs
Try Our .NET Reporting Tool
ActiveReports.NET Resources
