New Release! ActiveReportsJS - A JavaScript Reporting Solution
We are pleased to announce the latest JavaScript reporting solution, ActiveReportsJS. This is a JavaScript version of ActiveReports, built for .NET development. ActiveReports is a very popular tool for reporting and has been around for about 2 decades. A lot has changed since its inception, and many technologies have come and gone, yet ActiveReports has matured into one of the best reporting suites on the market. Now we have expanded the reporting capabilities of ActiveReports to the web platform.
In the past several years, web apps have become one of the most popular types of applications for companies to build. Modern browsers have also adopted new standards to improve browser performance and enable developers to create rich web experiences, which attributes to the growing complexity of web development.
While all this change was happening, we realized that there was a growing market for reporting in web applications. In comparison to the popular ActiveReport .NET version, ActiveReportsJS offers a similar set of functionalities.
A JavaScript Reporting Solution
ActiveReportsJS was designed to enable fast reporting in the browser for simplified reports. The ideal reporting scenario for using ActiveReports includes scenarios single-page reports with small to moderate data consumption. For example, a billing statement for a doctor’s visit, or an invoice for business expenses for the day. These uses cases involve a limited set of data and only a few pages.
To give you a better idea of why you might use ActiveReportsJS over ActiveReports for .NET, let’s consider the following scenario.
We are building a web application for e-commerce businesses. The application needs to be able to process orders online, so when a user decides to purchase, the application creates a purchase order and displays the order confirmation (report) to the customer. When the order confirmation is displayed to the customer, they have the option to save, print, or email a copy of the order to themselves. The order confirmation can list the items that were purchased, the price for each item, the total amount purchased, billing information, shipping information, and anything else relevant to the order. Most order confirmations can be summarized in a small report and do not need large amounts of data to process.
This is a perfect scenario for using ActiveReportsJS. The report can be created and rendered in the browser. There is no need to create a back-end reporting service to connect to and handle the report generation because the order information is already on the client-side, and the report can be rendered in the browser. Without getting into the weeds of this scenario, you can begin to paint a picture for this use case.
What’s included in ActiveReportsJS?
ActiveReportsJS includes several components: a rendering engine for generating reports, a viewer for viewing your reports, and a designer for creating and modifying your reports. There are also some additional features that allow functionality like exporting and printing.
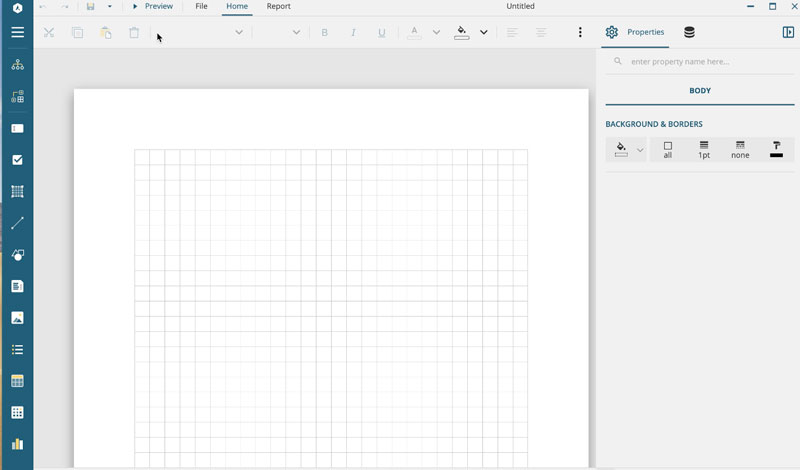
The Designer
ActiveReportsJS includes a designer for creating reports, and it can be used on Mac, Windows, and Linux machines.

When creating reports, you can connect to remote data sources or add your own local JSON files. JSON is the default format for data sources in ActiveReportsJS. After configuring your data sources, you can create various data sets to use in your reports.
The designer includes report controls which are displayed with icons along the left side of the designer. These tools are useful for adding functional and interactive pieces to your report. If you want to list data records, you can use a list, or table. If you need to aggregate data from a data set, throw it in a chart control. There are barcodes and dozens more to choose from!
When a report control is added to the design surface, the properties panel will appear. Use the properties panel to configure the control to your liking. You can change text, fonts, colors, dimensions and many other aspects of the control. There is also an ‘advanced properties’ mode for additional configuration. Enable this to fine tune your report.
To preview your report, click the “Preview” button in the menu toolbar. This will display the report as it would appear in the viewer of your application.
If you are not creating reports from scratch, you can also import an existing report. The designer includes a RDLX to RDLX-JSON converter tool also. Simply open a .RDLX report in the designer and save it to convert the report to ActiveReportsJS supported file type (.RDLX-JSON).
The Viewer
The Viewer component allows you to view the reports and embed reports in your application. It is responsive and can be viewed on desktop and mobile devices. The viewer has a toolbar and side menu for options. Both are configurable and you can hide them if you want to provide a more immersed experience.
Exporting Reports
Exporting reports is a very common task for report users. ActiveReportsJS currently supports PDF, Excel, and HTML exports in the viewer. To use the export feature, include the corresponding module in your application.
For additional information on the features above, you can visit the documentation.
Refer to ActiveReportsJS Demos for sample reports and features.
We are very excited to share this new product with the world. To get started, download ActiveReportsJS now!