ActiveReports 12, Service Pack 1 has arrived
The first service pack of ActiveReports 12 is here, and it's chockful of great enhancements and new features that you've been requesting for some time. First up, ActiveReports Developer. (Or skip to ActiveReports Server.)
Chart Enhancements
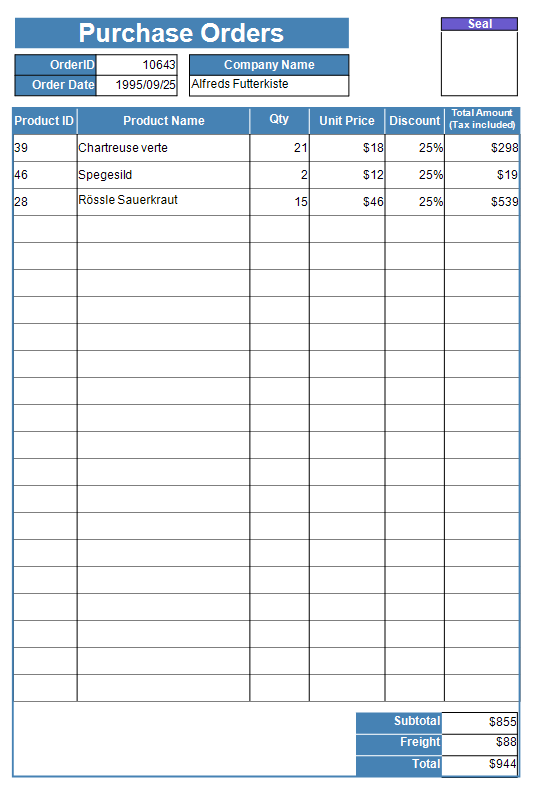
Add and customize series lines in column and bar charts. Properties include Style, Width, and Color:
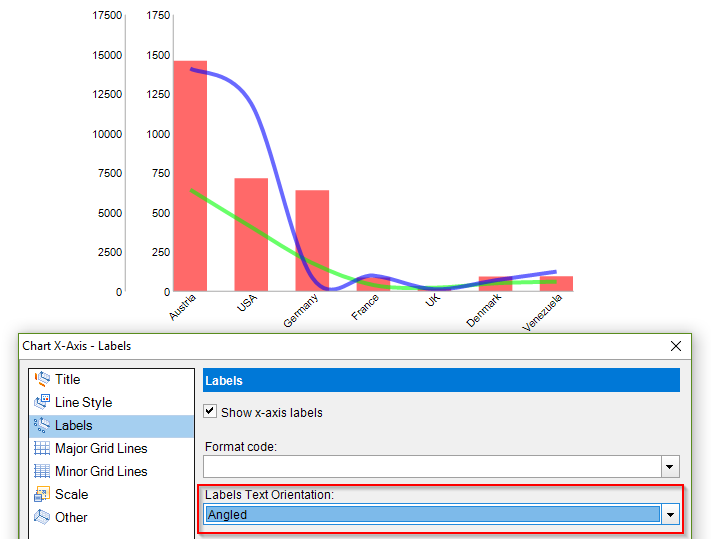
Change the text orientation in chart axis points with Text Orientation property. Options include Auto, Angle, Horizontal, Rotated90, Rotated270, and Stacked.
Read more about chart enhancements
CrossSectionBox enhancements
CrossSectionBox now includes a CloseBorder property. If your grouping in a Section Report spans multiple pages and needs a border, the CloseBorder property allows you to close the bottom and top borders of each page for that grouped section:

Read more about CrossSectionBox
Map enhancements
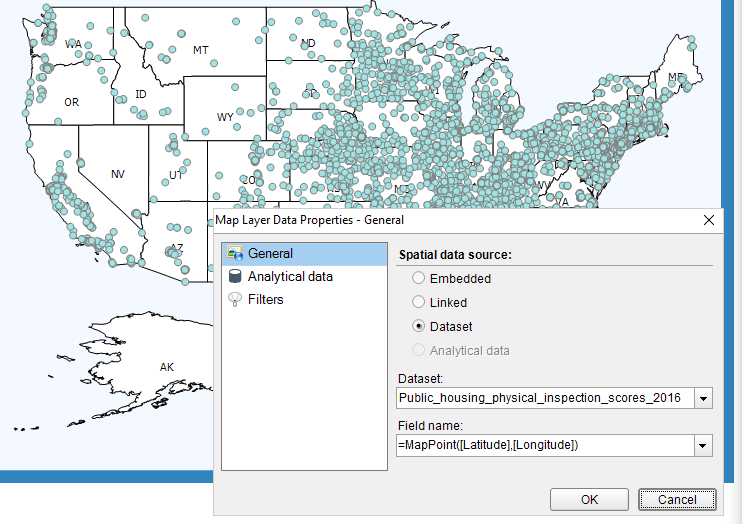
Now you can display geospatial data directly on the Map with a new function =MapPoint(<Latitude>,<Longitude>). This function is available for a map Point Layer only.
Read more about map enhancements
Read more ActiveReports 12 SP 1
Get ActiveReports 12 SP 1
ActiveReports 12 Server Service Pack 1
ActiveReports 12 Server Service Pack 1 includes a host of new features for the Web Designer, along with a great new feature for report adminstrators that you've been requesting for some time!
Admins can limit the number of report pages rendered in preview
ActiveReports 12 Server Service Pack 1 includes a host of new features for the Web Designer, along with a great new feature for report adminstrators.
By specifying a limit on how many pages of a report are rendered when previewing, administrators can ensure that very large reports will no longer slow down other report execution requests. For instance, if a report has 1000+ pages, you can specify that only 10 pages should render in the preview.
In addition, users can now cancel long-running report previews and force full reports to run.
Web Designer enhancements
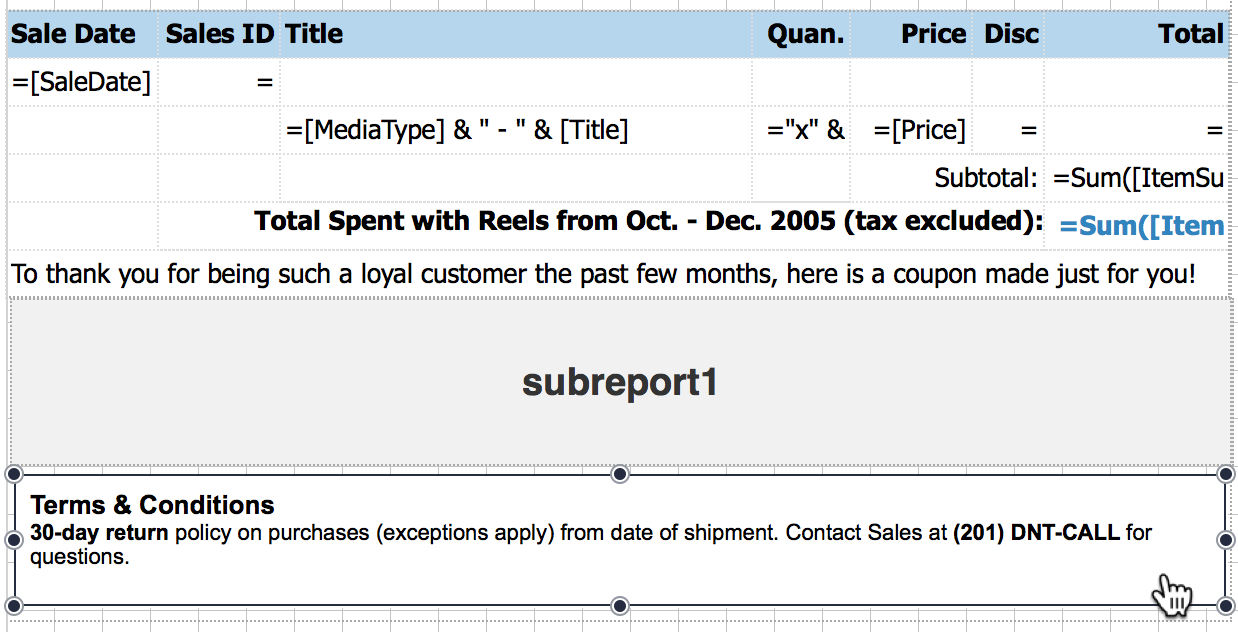
Barcode and Formatted Text controls have been added to the Web Designer:
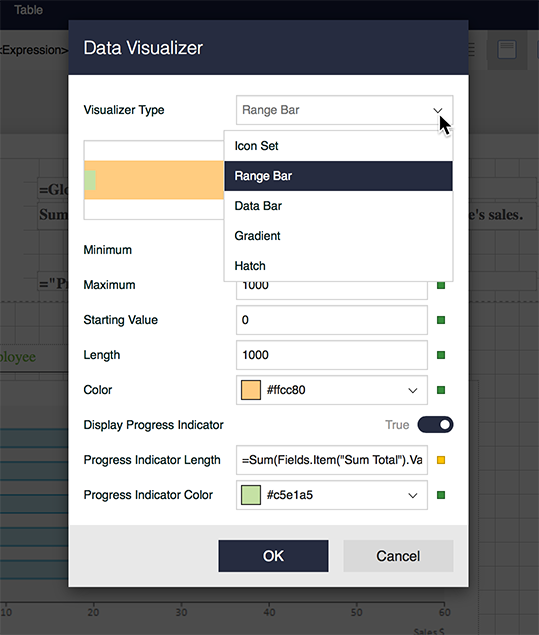
Data Visualizers have been added to the Web Designer. Data Visualizers allow you to create small graphs to make your data easier to understand. For example, you can red flag an overdue account using the Flags Icon Set as a background image. Several types of Data Visualizers are available through a dialog linked to properties on the Image and TextBox report controls.
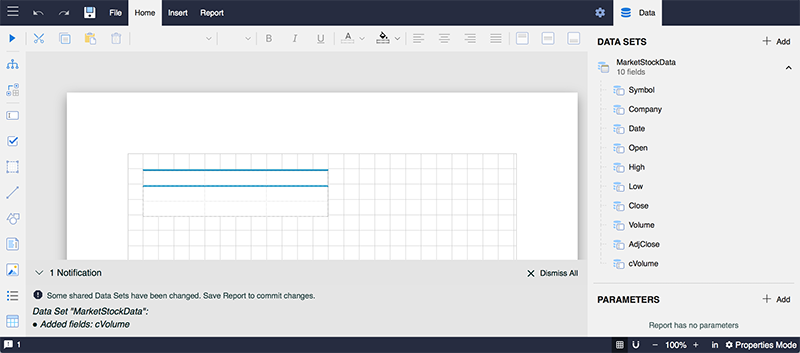
Shared dataset refresh in RDL and Page Reports: Now when a shared data set gets modified, you can refresh this data set in a report that uses it. When opening such a report in the Web Designer, a notification message will specify what data fields have been changed and ask you to save the report with a new data set version.
Smart filters have been added to semantic datasets. This new dataset query filter in RDL reports adds more flexibility and performance to filtering data in a semantic dataset. 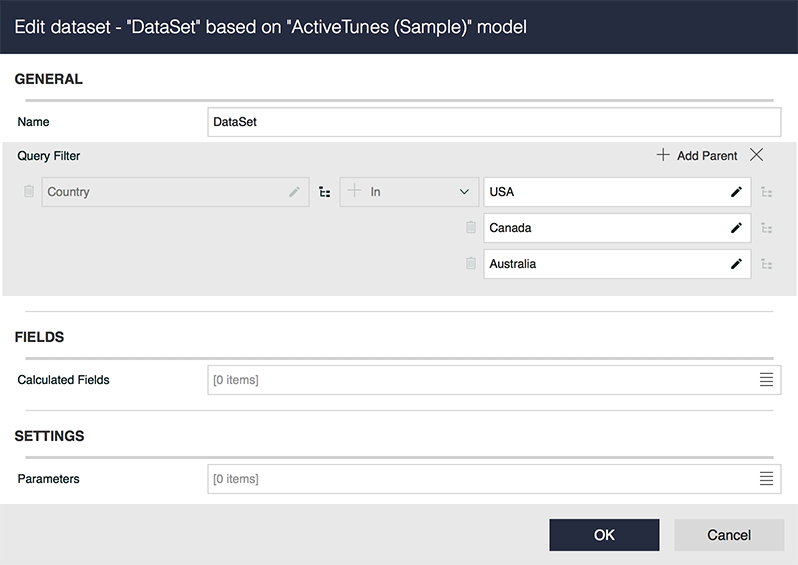
Additional enhancements
We've re-balanced semantic model-based datasets to increase intuitiveness and added property descriptions in the property panel.
Intelligent data models: We have improved the behavior of semantic data models in the Web Designer, and now data model relations are determined intuitively when a semantic data model is created, meaning that the main entity of a data model is displayed automatically at the top of the data set.
Design visually appealing reports with ease: While designing reports, the default styles are now automatically applied to the controls that support style features (Table, Tablix, Chart, Bullet, and Sparkline). So the users don't need to set the styles manually each time they add new controls. The default styles can be later easily modified from the Style property.
Support for stored procedures has been added to dataset queries.
Learn more about Web Designer and read about ActiveReports 12 Server SP 1.
