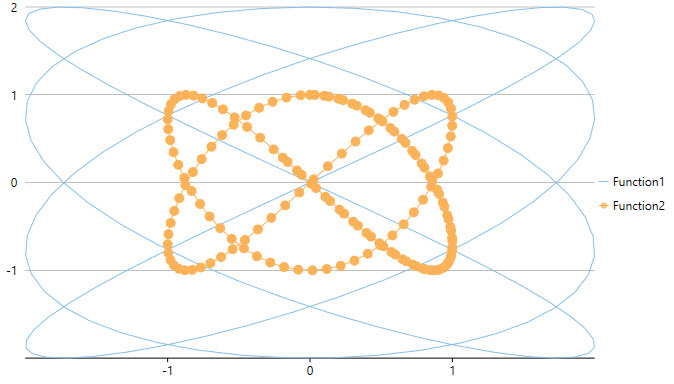
In a chart, there is often a common but crucial requirement to emphasize different types of data. Emphasizing or distinguishing different types of data is vital because chart data that is distinguishable is easier to interpret and understand.
FlexChart caters to this requirement by allowing you to combine two or more chart types in a single chart. For instance, you can combine the LineSymbols Chart with the Column Chart to make the chart data easier to interpret. You can use the ChartType property to specify the chart type at the series level for each series, thereby creating charts with multiple chart types.
The following code combines two chart types in a single chart.
