TopN Filtering in FlexPivot
There are numerous circumstances where information should be accumulated and sliced, and diced for analysis. This is helpful when there is a need to figure and sum up information to make various observations. ComponentOne WinForms Edition has a control called FlexPivot, which is intended to offer top of the line business insight capacities and advanced information examination to end clients.
FlexPivot is powered by a platform-independent data engine that performs data analytics locally in the application, without locking into another data analysis tool.
The control offers a FlexPivotPanel, designed to provide an Excel-like drag-and-drop UI that enables defining custom views of the data in real-time. It displays a list containing all the fields in the data.
These fields can be dragged-dropped to lists representing the row and column dimensions of the output table, the values summarized in the output data cells, and the fields used for filtering the data. This enables us to view the differences in a massive set of information and make multiple observations to reach a conclusion.

While analyzing the data, a need to identify top and bottom performing records from within a table based on a particular field might arise. To accomplish this, we need to initially sort the data and then write logic to hide the nonrequired rows in the grid.
As an alternate to this, FlexPivot now provides a TopN filtering feature, which makes it easier to display the top and bottom performing records without having to write the custom logic.
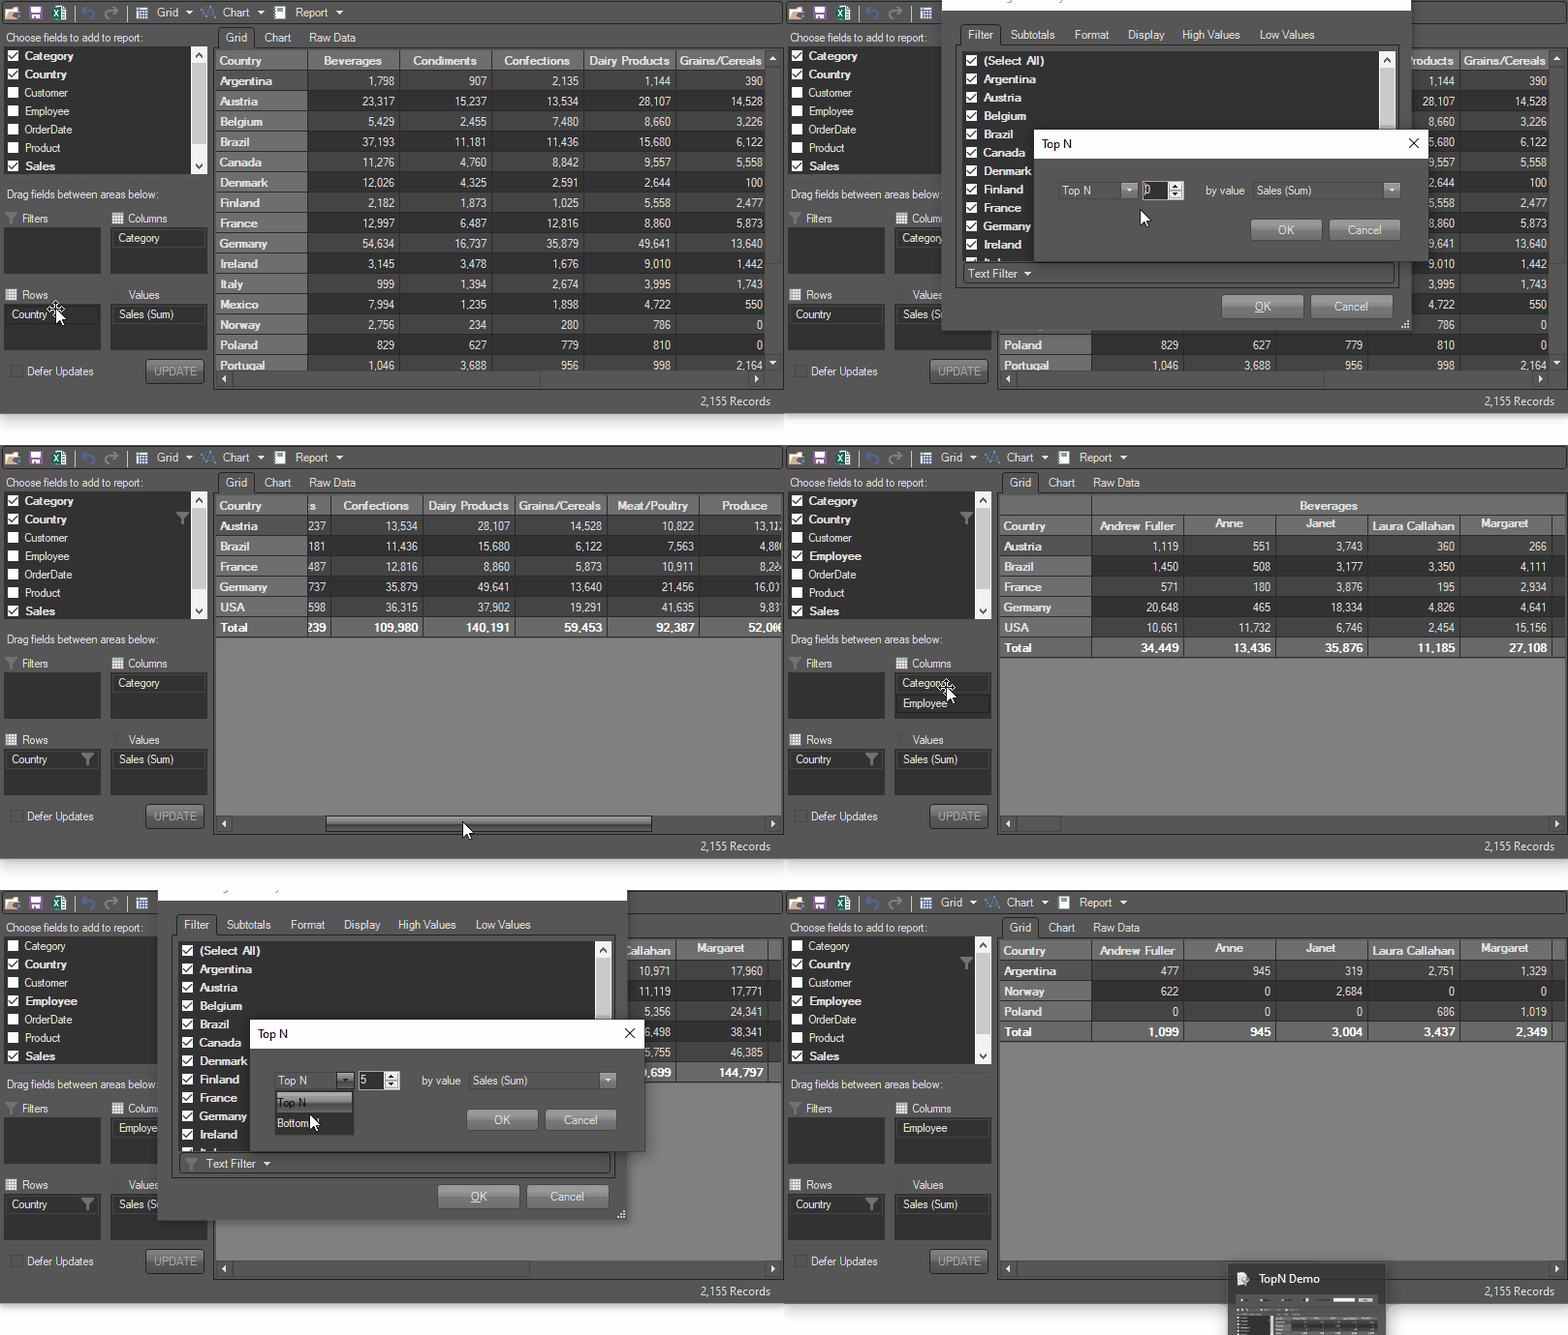
Let us understand the implementation of this FlexPivot’s filtering feature using a scenario where we will show the data from 5 countries with the highest sales and 5 employees with the lowest sales of products.
Implementing TopN and BottomN Filters in FlexPivot
To get 5 countries with the highest sales of products, we will first bind the FlexPivot to a data source containing information about sales of the company. Once the pivot is bound, it is time to add the filters to get the desired data.
Filter Property: Get the C1FlexPivotFilter object of the “Country” field on which the filter is to be applied.
var filter = flexPivotPage1.FlexPivotEngine.RowFields["Country"].Filter;
TopN Property: This property specifies the number of elements with the highest (lowest) values in the output. Here we are showing the top 5 countries.
filter.TopN = 5;
TopNRule Property: This property decides whether the filter returns top N or bottom N elements. Here we are looking for the top countries in terms of sales.
filter.TopNRule = TopNRule.TopN;
TopNValueField Property: This property defines the value field used to calculate the TopN or BottomN elements.
filter.TopNValueField = flexPivotPage1.FlexPivotEngine.ValueFields[“Sales”];

Similarly, we can get 5 employees with the lowest sales of products using BottomN filters. We need to change the filter field and TopNRule property in the above-given code.
var filter = flexPivotPage1.FlexPivotEngine.RowFields["Employee"].Filter;

filter.TopNRule = TopNRule.BottomN;

Designer Support
It is also possible to set the TopN and BottomN filters at runtime via FlexPivot designer. To do this:
- Right-click a field name. Click the Field Settings option to open the Field Settings dialog. This invokes the Field Settings dialog.
- Select the TopN option in the filter dropdown menu.
- In the TopN dialog, the user can choose between TopN or BottomN and assign the number of elements to be filtered. Users can also set a value field in the by value option.

Try it yourself! Please leave any questions in the comments section below.
