SpreadJS 12 brings a major feature enhancement to your favorite JavaScript spreadsheet component: shapes! Comprised of both built-in and custom shapes, this new feature gives you the power to enhance your spreadsheets and applications with data-driven graphics, flowcharts, Gantt charts, annotations, and all your shapes needs.
Work with built-in Excel-like shapes in your JavaScript app
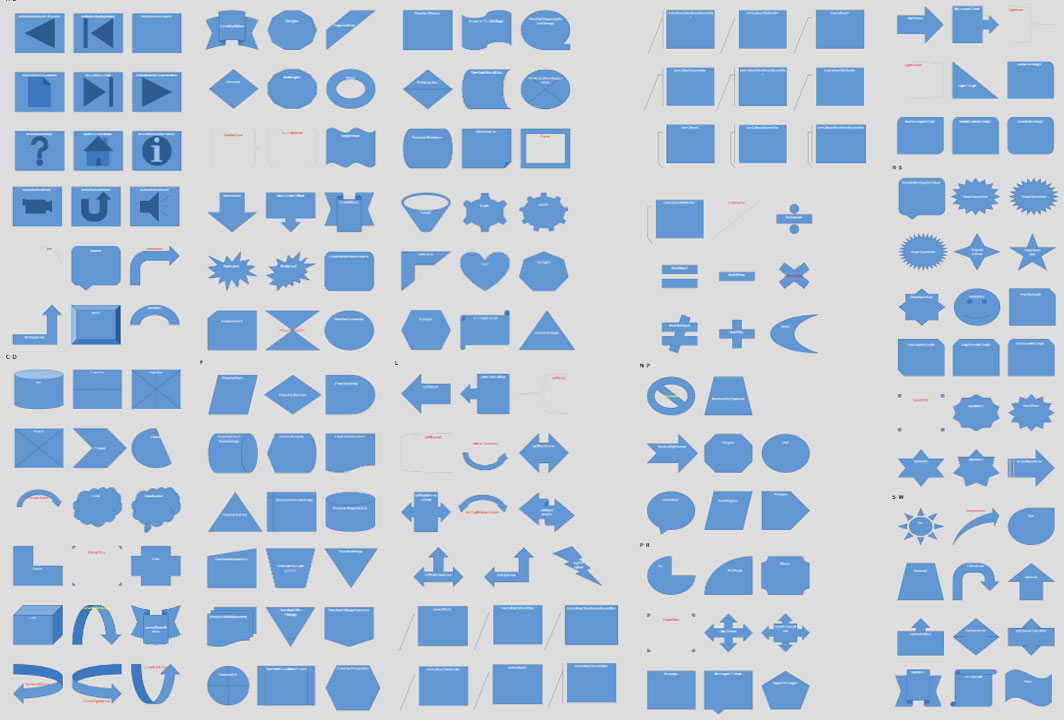
With built-in shapes, you can seamlessly import and export your Excel workbooks with shapes without any feature loss. The 60+ built-in shapes include basic shapes, arrows, balloons, and action buttons. You can easily build diagrams and dashboards.
Here's a look at all the shapes available in SpreadJS 12:

Add shapes to your SpreadJS app in code
Built-in shapes can be easily added with code, only requiring a single function:
var heart = sheet.shapes.add('autoShape', GC.Spread.Sheets.Shapes.AutoShapeType.heart, 100, 50, 100, 150)
You can also configure the shape's fill color, border, and text using the shape style API:
heart.text('My Shape');
var heartStyle = heart.style();
heartStyle.fill.color = 'pink';
heartStyle.fill.transparency = 0.5;
heartStyle.line.color = 'green';
heartStyle.line.lineStyle = GC.Spread.Sheets.Shapes.PresetLineDashStyle.dashDot;
heartStyle.line.width = 5;
heartStyle.line.capType = GC.Spread.Sheets.Shapes.LineCapStyle.square;
heartStyle.line.joinType = GC.Spread.Sheets.Shapes.LineJoinStyle.miter;
heartStyle.line.transparency = 0.5;
heartStyle.textEffect.font = 'bold 15px Georgia';
heartStyle.textEffect.color = 'yellow';
heartStyle.textEffect.transparency = 0.5;
heartStyle.textFrame.vAlign = GC.Spread.Sheets.VerticalAlign.center;
heartStyle.textFrame.hAlign = GC.Spread.Sheets.HorizontalAlign.center;
heart.style(heartStyle);
Add shapes to your app in the SpreadJS Designer
The easiest way to add shapes to a workbook with Spread is to use the Designer. In the "Insert" tab, you'll find a new "Shapes" drop down that shows all the available shapes:

To add one, simply click on the desired shape, and it appears in the sheet, where you can start customizing it.
When you select a shape on the sheet, the "Design" tab opens up, showing different properties that can be set for that shape, including styles, rotation, and size. You can also change the shape without losing set properties, which means you can easily update your diagrams as you go.
Create data-driven custom shapes
The most exciting feature of SpreadJS shapes is the ability for you to create your own custom shapes. This brings SpreadJS a level above a spreadsheet: now more advanced diagrams and applications can be created. This includes things like seating charts, machine/electronic status monitoring, profit analysis, and organization charts, just to name a few.
One of the powerful functions of custom shapes is the ability to generate them from data. Similar to charts, custom shape properties can be driven by specific data, whether defined in the code or defined as a cell range reference in the workbook. This allows users to easily import your data and have shapes created for them in the form of developer-defined diagrams and dashboards.
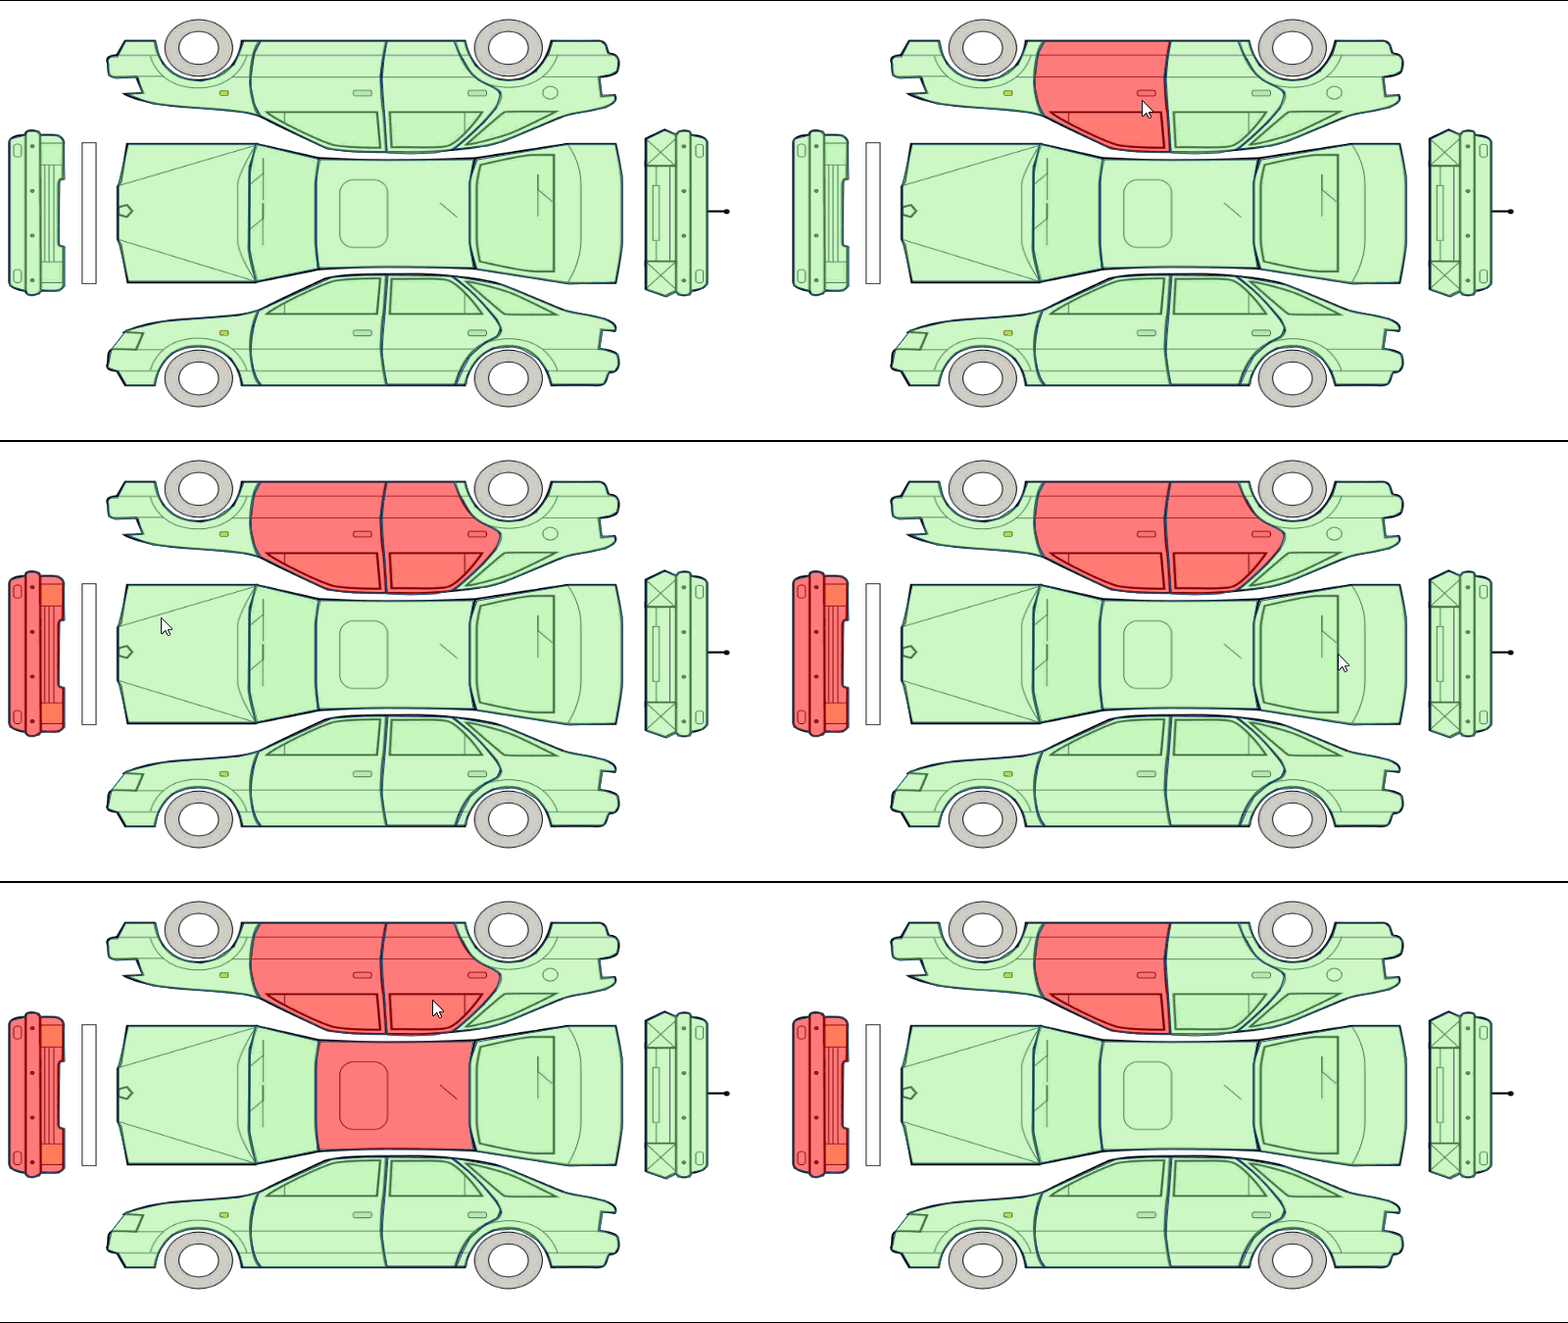
A perfect example of this is our Car Insurance sample, which you can read more about in the Build a JavaScript car insurance app blog post. In that sample, the data is in a separate sheet, and the shapes in the diagram are defined using the data in that sheet:

While there isn't a custom shapes menu for the Designer, they can be defined via code. In this fashion, you can define a model with different properties, and then apply that model to the shape when added:
var shapeModel = {
    left: "=Sheet1!B7",
    top: "=Sheet1!C7",
    width: "=Sheet1!D7",
    height: "=Sheet1!E7",
    options: {
        fill: {
            type: 1,
            color: startColor,
            transparency: "0.5"
        }
    },
    path: [
        [
            ["A", 100,75,40,0,2*Math.PI],
            ["Z"]
        ]
    ]
};

sheet.shapes.add('MyShape', shapeModel);

There's so much more that can be done with SpreadJS shapes than what we've covered here. With the added functionality, SpreadJS can be a better fit for more types of applications, proving that SpreadJS is more than just a spreadsheet. Here are some ideas:
- Create a visual, interactive floor plan that allows users to see who sits at a desk, or add information about amenities
- Create a production floor plan for a manufacturing facility, and highlight areas experiencing slowdowns or problems
- Create Gantt charts and org charts
