How to Build a Balance Sheet in an Angular Report Designer
| Quick Start Guide | |
|---|---|
| What You Will Need |
ActiveReportsJS Report Designer NPM VisualStudio Code Angular |
| Controls Referenced | Angular Report Designer |
| Tutorial Concept | Angular Balance Sheet - Using the ActiveReportsJS Angular report designer component, many different types of data can be visualized, including financial reports (such as balance sheets) in a web application. |
Businesses use balance sheets to provide a snapshot of their financial position at a specific point in time. By summarizing assets, liabilities, and equity, these reports help creditors, investors, and stakeholders evaluate a company's financial health and stability.
For developers building business applications, generating and delivering reports like balance sheets is a common requirement. Users expect to design, view, and interact with reports directly within the applications they use, regardless of device or location. ActiveReportsJS makes this easy with its Angular Report Designer and Viewer, enabling you to build, customize, and display reports entirely in the browser. In this tutorial, you'll learn how to create a balance sheet report with the Angular Report Designer and display it using the Angular Report Viewer.
In this article, we’ll be covering the following topics:
- Adding the Angular Report Designer to an Application
- Saving the Report Details
- Adding a Data Source and Data Set to the Report
- Designing the Balance Sheet and Binding Data to Controls
If you’d like more information about Angular integration, you can check out our documentation.
Ready to Get Started? Download ActiveReportsJS Today!
Adding the Angular Report Designer to an Application
The first thing that we’ll need to do is add the ActiveReportsJS Angular packages to our application. Inside the folder of the application, run the following command:
npm i @grapecity/activereports-angularAfter a moment of installation, you’ll have access to the ActiveReportsJS Angular library in your application. Next, we’ll need to ensure that the proper modules are loaded into the application and that we reference all of the required files.
Inside the app.module.ts file, import the following module:
import { ActiveReportsModule } from '@grapecity/activereports-angular';This will ensure we can access the Angular Report Designer in our markup. Also, do not forget to add it to your imports list:
imports: [
  BrowserModule,
  ActiveReportsModule
]
Now, we can reference the Report Designer in our application; however, before implementing the designer, we’ll need to include the required CSS files.
For ActiveReportsJS, we need to import these files in the styles.css file of the application. The files must be loaded here, or the styles will not be applied to the control. Inside of this file, include the following imports:
@import "@grapecity/activereports/styles/ar-js-ui.css";
@import "@grapecity/activereports/styles/ar-js-designer.css";
Now that all required files have been imported, we can start working with the Report Designer in markup. To reference the Report Designer, include the following code in the app.component.html file:
<div id="designer-host">
  <gc-activereports-designer></gc-activereports-designer>
</div>
That’s all there really is to include the Angular Report Designer in your application. Note that we’re also including a div wrapped around the designer. This is so that we can use it to control the size. By default, the designer will fill whatever element it’s placed in, so we do this to control the size.
Inside the app.component.css file, we set the size using the following code:
#designer-host {
  width: 100%
  height: 100%
}
Now, when we run the application, we should see the following:

With that complete, we can add functionality to save the report, which we’ll cover in the next section.
Saving the Report Details
With the Report Designer added to our application, we’ll next need to add the ability for users to save their reports. Thankfully, the ActiveReportsJS Report Designer features several built-in events that allow us to do so: the onSave and onSaveAs events.
In the app.component.html file, modify the markup of the report designer to match the following:
<gc-activereports-designer [onSave]="onSaveReport" [onSaveAs]="onSaveAsReport"></gc-activereports-designer>This will bind two methods, onSave and onSaveAs, to these two events. Now, inside the app.component.ts file, we’ll implement these methods so that they can be used when the events are fired:
counter = 0;
reportStorage = new Map();
onSaveReport = (info: any) => {
  const reportId = info.id || `NewReport${++this.counter}`;
  this.reportStorage.set(reportId, info.definition);
  return Promise.resolve({displayName: reportId});
}

onSaveAsReport = (info: any) => {
  const reportId = `NewReport${++this.counter}`;
  this.reportStorage.set(reportId, info.definition);
  return Promise.resolve({id: reportId, displayName: reportId});
}
Here, we first create a Map() to store the key-value pairs used by the report. Then, passing the report information as an argument, we map the report data to the map and return a promise containing the report information.
Note that this is using the in-memory reports storage. When implementing this live, you’ll likely want to pass the report definition, a JSON object, to your backend for storage.
Adding a Data Source and Data Set to the Report
With the designer implemented and save functionality included, it’s time to get to work building out the balance sheet. However, before we start including controls in the report, we will need to obtain some data to display in them.
To bind data to a report, we will first need to add a Data Source. The data source is where we’ll retrieve the data.
To add a data source, open up the Data Panel and click the Add button in the data source panel:
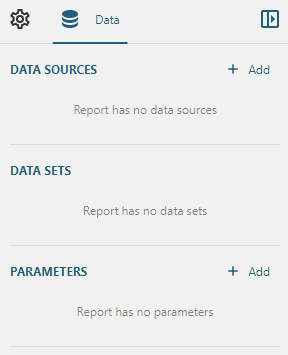
This will bring up the data source wizard:
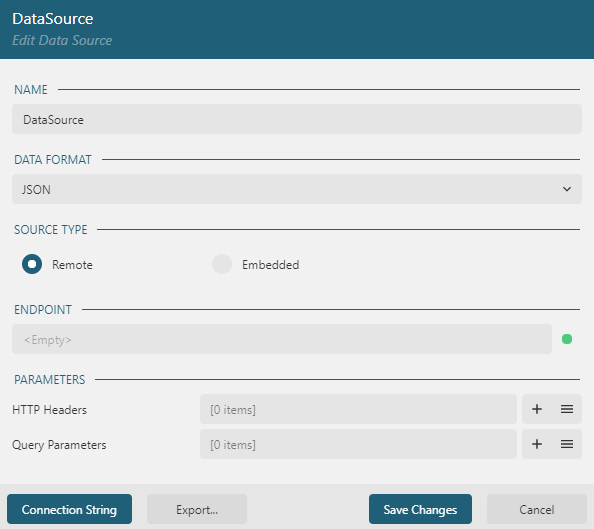
ActiveReportsJS supports two data-binding methods (remote and embedded) and two data types (JSON and CSV). For the purposes of this demonstration, we'll use embedded JSON data as our data source.
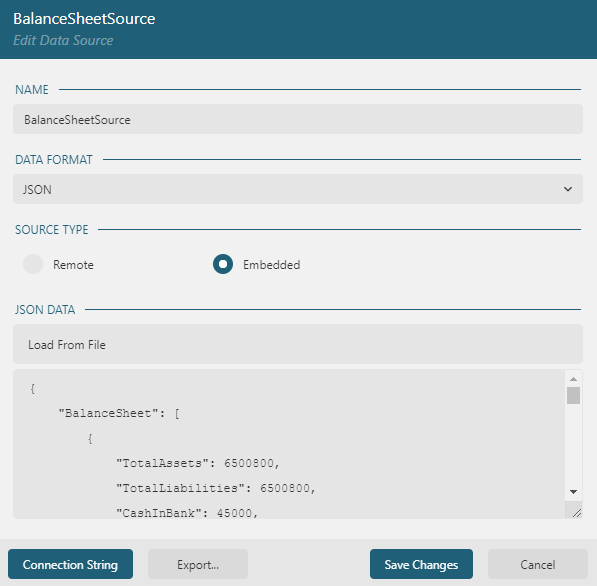
Now, we have a source from which we can pull the data. However, we need to create a data set that can be used to hold that data, allowing us to reference it in the report. With the source added, we’ll need to click on the Add button next to our data source to bring up the data set creation wizard:
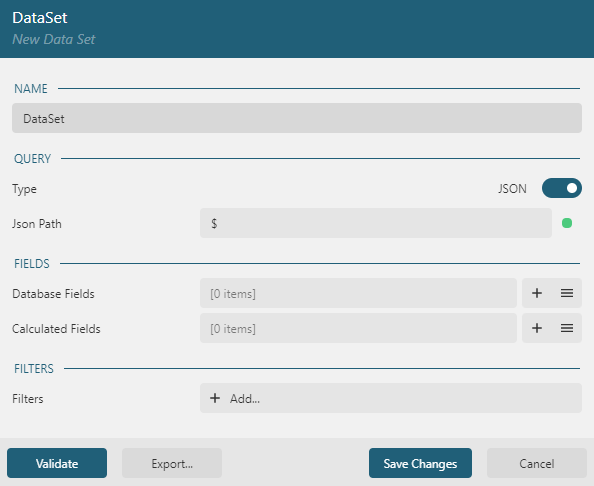
This is where we can set up the actual data that we’re pulling into the report. Note that if you’re using remote data, there will be additional options for parameters and so on that you can pass to your backend. Since we’re embedding our data, we have fewer options here.
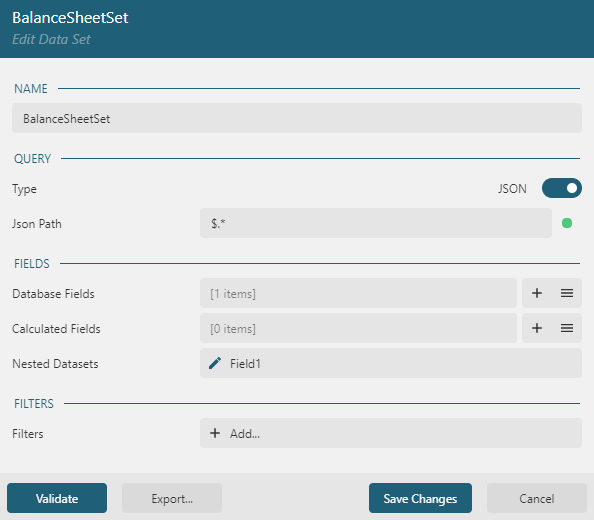
To properly load the data in, we’ll need to set the JSON Path field. This acts as a filter of sorts, allowing you to control which data is retrieved when building the dataset. For our scenario, we want all available data, so we use the string $.*, which tells the Report Designer to pull in all available data.
Before we save the data source, we need to ensure we can validate the data. This just checks that the data set can actually pull data from the source when building the report. If everything is as expected, you should see the Database Fields array populated with values:
With that complete, we have data that we can connect to controls. In the next section, we’ll build out the balance sheet and add data to the various components used.
Designing the Balance Sheet and Binding Data to Controls
With our data set up, we can now build out the balance sheet in the report designer. The first thing we’re going to do is set up a page header to identify the report. At the top of the designer, click on the Section tab and select Add Header. This will add a header section to the top of this report.
Next, we’re going to drag a TextBox and an Image control into the page header. For the TextBox, we will set the text to Balance Sheet, and we will embed an image in the report that we’ll use within the Image control.
To embed an image, select the Image control, then in the Action section of the Properties Panel, open the Image dropdown, select the Embedded option, and click the Load button to open the file explorer and select the image you want to upload.
After adding these controls (with a little bit of styling), the page header should look something like this:

Now, we will add some controls to display the company’s total assets and total liabilities. Drag and drop a table control from the control toolbox onto the report. Next, we will delete the header and footer rows. This is done by right-clicking a cell in the row we want to remove, hovering over the Row option, and selecting Delete Row. We’re also going to delete a column, so follow the same steps above, except select Column and Delete Column.
Then, copy and paste this table so that we have two. For the cells in the first table, we’re going to set their values as Total Assets and {TotalAssets}, and Total Liabilities and {TotalLiabilities}.
Finally, select the second cell in each table, navigate to the Format property in the Properties Panel, and set it equal to Currency; this will ensure that our monetary values display in a currency format.
After some additional styling, our report now appears as shown below:

With that complete, it’s time to start adding additional tables to show all of the various assets and liabilities of the company. For this, we’re going to have six tables covering the following areas:
- Current Assets
- Current Liabilities
- Fixed Assets
- Long-Term Liabilities
- Other Assets
- Shareholders Equity
To make this easier, we will create a table template that we can then duplicate and fill out with the rest of our data.
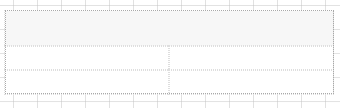
Drag and drop another table control onto the report, this time keeping the header and footer rows but removing one of the columns so that we only have two.
Then, we’re going to select both cells in the header row and merge them using the context menu. Finally, we’ll also add some styling so that the header and footer rows stand out. We’re going to set the background of the header row to grey, and then we'll set the footer row's text color to grey. Finally, in the second column, we will again set the format to 'Currency.'
When complete, the table should look something like this:
Now, we’re going to duplicate this table for each table of data that we will implement. In the case of this balance sheet, we will have six tables: Current Assets, Current Liabilities, Fixed Assets, Long-Term Liabilities, Other Assets, and Shareholders Equity. See the tables below to view how each are set up:
| Current Assets | |
| Cash in Bank | {CashInBank} |
| Inventory | {Inventory} |
| Prepaid Expenses | {PrepaidExpenses} |
| Other | {OtherCurrentAssets} |
| Total | {Sum(TotalCurrentAssets)} |
| Current Liabilities | |
| Accounts Payable | {AccountsPayable} |
| Taxes Payable | {TaxesPayable} |
| Notes Payable (12 mo.) | {NotesPayable} |
| Current Portion Long-term Debt | {CurrentPortion} |
| Other Current Liabilities | {OtherCurrentLiabilities} |
| Total | {Sum(TotalCurrentLiabilities)} |
| Fixed Assets | |
| Machinery & Equipment | {MachineryAndEquipment} |
| Furniture & Fixtures | {FurnitureAndFixtures} |
| Leasehold Improvements | {LeaseholdImprovements} |
| Real Estate \ Buildings | {RealEstateAndBuildings} |
| Other | {OtherFixedAssets} |
| Total | {Sum(TotalFixedAssets)} |
| Long-Term Liabilities | |
| Bank Loans Payable | {BankLoansPayable} |
| Short-term Portion | {ShorttermPortion} |
| Notes Payable to Stockholders | {NotesPayableToStockholders} |
| Other Long-term Debt | {OtherLongTermDebt} |
| Total | {Sum(TotalLongTermLiabilities)} |
| Other Assets | |
| Receivable from Employee | {ReceivableFromEmployee} |
| Receivable from Clients | {ReceivableFromClients} |
| Intangible Assets | {IntangibleAssets} |
| Total | {Sum(TotalOtherAssets)} |
| Shareholders Equity | |
| Common Stock | {CommonStock} |
| Additional Paid-in Capital | {AdditionalPaidIn} |
| Retained Earnings | {RetainedEarnings} |
| Total | {Sum(TotalShareholderEquity)} |
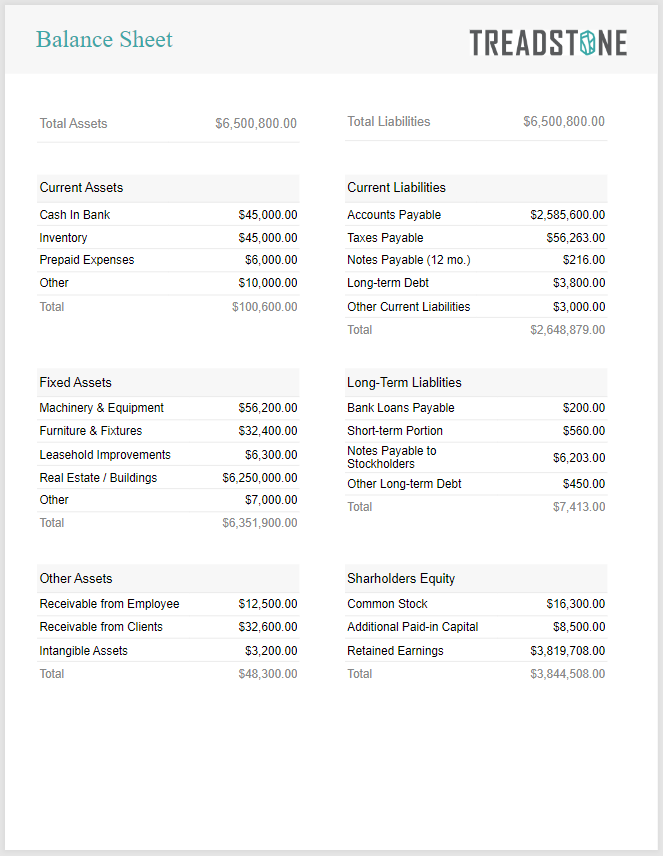
With the tables set up, the report is complete! If you preview the report, it should look similar to this:
Conclusion
Building financial reports doesn't have to require complex custom UI or extensive development effort. With ActiveReportsJS and its Angular Report Designer and Viewer, you can create polished, interactive balance sheets that integrate directly into your web applications while giving end users the flexibility to design and view reports in the browser. Whether you're building internal business tools, financial dashboards, or enterprise reporting solutions, ActiveReportsJS provides the components you need to deliver professional reporting experiences faster. Download ActiveReportsJS today and start building browser-based reports for your Angular applications.
Ready to Try It Out? Download ActiveReportsJS Today!
Happy coding!
Tags:
Related Blogs
Try Our JavaScript Reporting Tool
ActiveReportsJS Resources
