In traditional report design, dataset bindings are locked in during authoring. But in many real-world scenarios, such as dashboards or interactive filters, you want users or the app to define data sources on the fly. Runtime Data Binding enables just that, dynamically injecting data into your Angular Reporting component at runtime.

In this article, we’ll show you how to set up your report to allow data to be bound at runtime. We’ll be covering the following topics:
-
Design-Time Setup: Data Source & Data Set
-
Building the Report: Adding Controls & Defining Data Fields
-
Integrating the Library: Add ActiveReportsJS to Angular Application
-
Binding Data: Loading the Data at Runtime
If you’d like to follow along with the completed report and application, you can find the repository here.
Ready to Start Building Reports? Download ActiveReportsJS Today!
Design-Time Setup: Data Source & Data Set
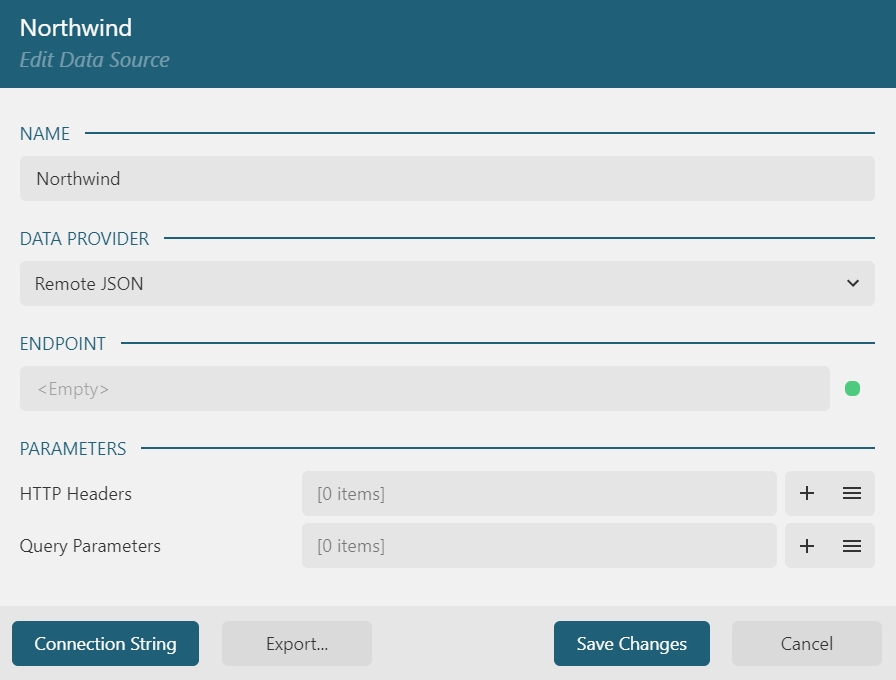
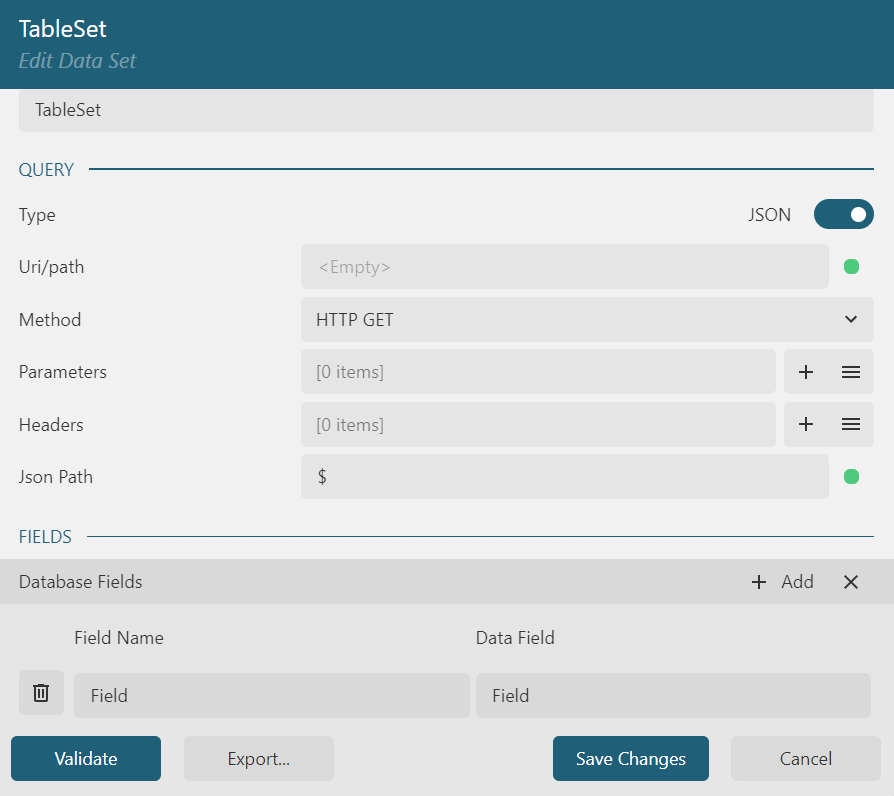
To support Report Data Binding at runtime, start by configuring an Embedded JSON data source without pre-defining endpoint details. In your report designer, leave the data source and dataset properties blank. This keeps them flexible for later configuration in code.


The reason we set up the data source and data set like so is simple; adding these in the Report Designer adds these properties to the JSON stored in the rdlx-json file. This will allow us to access and set these properties at runtime.
Building the Report: Adding Controls & Defining Data Fields
Now that we’ve got our JSON properties set up in the rdlx-json through the Data Source and Data Set, it’s time to add some controls to the report body. For our report, we will add a Table; drag and drop a table control from the control toolbox onto the report body.
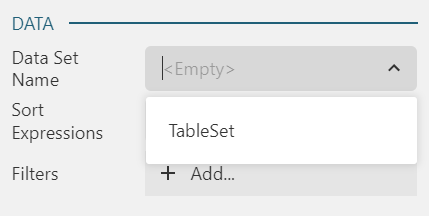
Now, select the table, and in the Properties Panel of the Report Designer, set the Data Set Name property to our TableSet data set:

Now, we’ve tied the table control to our data set (which currently has no data). When we bind this data set during runtime, our table will also get bound to the data we provide. However, we’re not done yet.
Now, we need to set up our table with properties that will be contained in our data set. The data set that we’ll be using will contain information based on customer orders, so we’re going to reference some of the properties that we know will be in our data set:

Usually, we’d preview the report to see how it would look in the Angular Report Viewer. However, if we try to preview our report, we’ll see an error message:

This is because we never properly defined the data source or set, meaning our data set has none of the properties we’re referencing. That’s okay, though, because those will be set at runtime.
Integrating the Library: Add ActiveReportsJS to an Angular Application
Now that we have our rdlx-json file, we can go ahead and get our application set up to use the ActiveReportsJS Angular Report Viewer.
First, install the Angular package:
npm install @mescius/activereportsjs-angular@latest
Then, in your Angular application:
@import "@mescius/activereportsjs/styles/ar-js-ui.css";
@import "@mescius/activereportsjs/styles/ar-js-viewer.css";
import { ActiveReportsModule } from '@mescius/activereportsjs-angular';
// ...
imports: [
  BrowserModule,
  ActiveReportsModule
]
<div id="viewer-host">
  <gc-activereports-viewer (init)="onViewerInit()"></gc-activereports-viewer>
</div>
#viewer-host {
  width: 100%;
  height: 100vh;
}
import {
  ViewerComponent,
  AR_EXPORTS,
  PdfExportService,
  HtmlExportService,
  TabularDataExportService
} from "@mescius/activereportsjs-angular";
// ...
@Component({
  // ...
  providers: [
    { provide: AR_EXPORTS, useClass: PdfExportService, multi: true },
    { provide: AR_EXPORTS, useClass: HtmlExportService, multi: true },
    { provide: AR_EXPORTS, useClass: TabularDataExportService, multi: true }
  ]
})
Now that that’s all set up, we can move on to the final section and bind our report to data at application runtime.
Binding Data: Loading the Data at Runtime
Now that the Angular Report Viewer component is set up, we can write the code that will bind the data to the report when our application runs. Inside of our Angular application:
@ViewChild(ViewerComponent, { static: false }) reportViewer: ViewerComponent;
dataSetFields = [
  {
    "Name": "orderId",
    "DataField": "orderId"
  },
  {
    "Name": "customerId",
    "DataField": "customerId"
  },
  {
    "Name": "employeeId",
    "DataField": "employeeId"
  },
  {
    "Name": "orderDate",
    "DataField": "orderDate"
  },
  {
    "Name": "requiredDate",
    "DataField": "requiredDate"
  },
  {
    "Name": "shippedDate",
    "DataField": "shippedDate"
  },
  {
    "Name": "shipVia",
    "DataField": "shipVia"
  },
  {
    "Name": "freight",
    "DataField": "freight"
  },
  {
    "Name": "shipName",
    "DataField": "shipName"
  },
  {
    "Name": "shipAddress",
    "DataField": "shipAddress"
  },
  {
    "Name": "shipCity",
    "DataField": "shipCity"
  },
  {
    "Name": "shipRegion",
    "DataField": "shipRegion"
  },
  {
    "Name": "shipPostalCode",
    "DataField": "shipPostalCode"
  },
  {
    "Name": "shipCountry",
    "DataField": "shipCountry"
  },
];
async loadData() {
  const headers = new Headers();
  const dataRequest = new Request(
    "https://demodata.grapecity.com/northwind/api/v1/Orders",
    {
      headers: headers,
    }
  );
  const response = await fetch(dataRequest);
  const data = await response.json();
  return data;
}
async loadReport() {
  const reportResponse = await fetch("/assets/DynamicDataBinding.rdlx-json");
  const report = await reportResponse.json();
  return report;
}
async onViewerInit() {
  const data = await this.loadData();
  const report = await this.loadReport();
  report.DataSources[0].ConnectionProperties.ConnectString = 'jsondata=' + JSON.stringify(data);
  report.DataSets[0].fields = this.dataSetFields;
  report.DataSets[0].Query.CommandText = 'jpath=$.*';
  this.reportViewer.open(report);
}
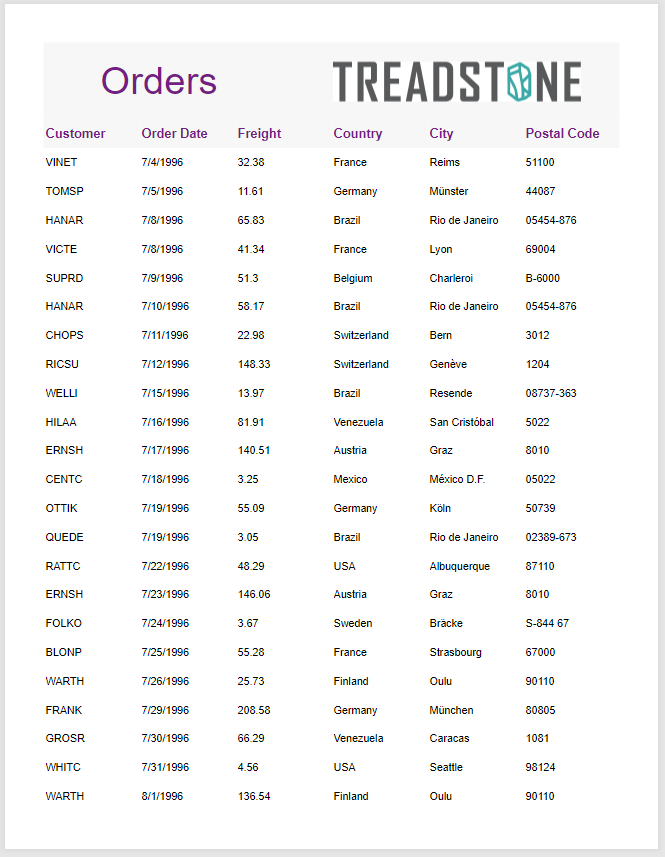
When we run our application, we should see the following in the Angular Report Viewer:

Conclusion
Ready to Start Building Reports? Download ActiveReportsJS Today!


