WinForms Sunburst
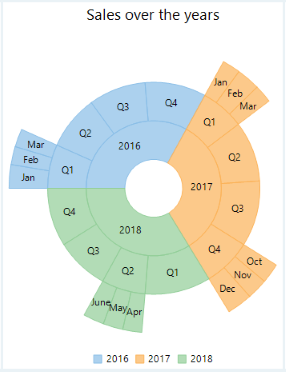
Imagine delving into a complex dataset, uncovering the intricate relationships hidden within, this is where the Sunburst chart excels, transforming raw data into a vibrant, multi-dimensional narrative. Also known as a multi-level pie chart, the Sunburst chart is ideal for visualizing hierarchical data across multiple levels using concentric circles. The central circle represents the root node, while the surrounding rings correspond to different hierarchy levels. Each ring is segmented based on its relationship to the parent slice, with divisions either equally distributed or proportional to specific values. For instance, the below image illustrates the Sunburst chart representing sales over the past years, showcasing different makes and models of a product.
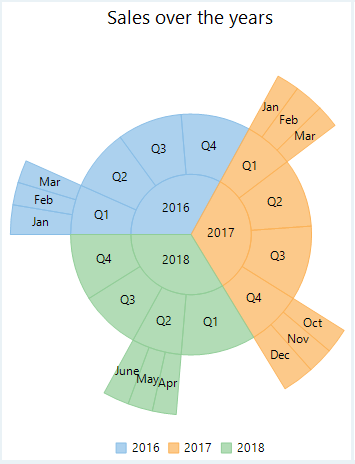
The FlexChart includes a standalone Sunburst Chart represented by the Sunburst class. Initially, the chart appears as a pie chart when placed on the form. However, it transforms into a sunburst chart once hierarchical data is assigned through the DataSource property inherited from the FlexPie class. The FlexPie class also provides Binding and BindingName properties, enabling you to set numeric values and labels for sunburst slices. Additionally, you can define the starting angle for drawing the slices in a clockwise direction using the StartAngle property.
Sunburst with Hierarchical Data
At design-time
Drag and drop the Sunburst control to the form.
Right click the Sunburst control on the form to open Properties window.
Set the data source using the DataSource property.
Configure the chart by setting the Binding and BindingName property.
Set the ChildItemsPath property to name of the property that contains child items.
Using code
Initialize the control to clear the default series.
Set the data source through the DataSource property,
Configure the chart by setting Binding and BindingName property.
Set the ChildItemsPath property to generate child items in hierarchical data.
//Specify the field containing values for pie slices
sunburst1.Binding = "Value";
//Specify the fields containing labels for pie slices and legend
sunburst1.BindingName = "Year,Quarter,Month";
//Specify the fields containing values for child pie slices
sunburst1.ChildItemsPath = "Items";
//Set the data label position
sunburst1.DataLabel.Position = PieLabelPosition.Center;
//Set the data label content
sunburst1.DataLabel.Content = "{name}";
//Set the tooltip label content
sunburst1.ToolTip.Content = "In {name} Sales : {value}\nShare : {P:0}%";
//Specify the data source
sunburst1.DataSource = GetSunburstData();
//Set the data label content
sunburst1.Header.Content = "Sales over the years";
'Specify the field containing values for pie slices
sunburst1.Binding = "Value"
'Specify the fields containing labels for pie slices and legend
sunburst1.BindingName = "Year,Quarter,Month"
'Specify the fields containing values for child pie slices
sunburst1.ChildItemsPath = "Items"
'Set the data label position
sunburst1.DataLabel.Position = PieLabelPosition.Center
'Set the data label content
sunburst1.DataLabel.Content = "{name}"
'Set the tooltip label content
sunburst1.ToolTip.Content = "In {name} Sales : {value}" & vbLf & "Share : {P:0}%"
'Specify the data source
sunburst1.DataSource = GetSunburstData()
'Set the data label content
sunburst1.Header.Content = "Sales over the years"Sunburst with Flat Data
In addition to their traditional use with hierarchical data, Sunburst charts are also flexible to handle data from flat data files, such as CSV and TSV formats. For example, the image below illustrates a Flat Sunburst chart representing sales over the past years.
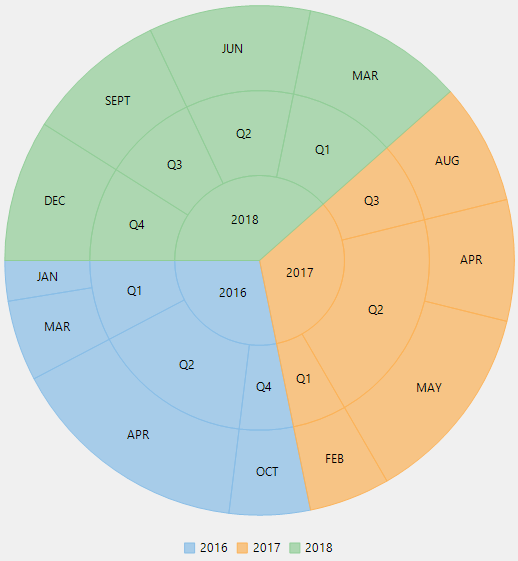
For creating flat Sunburst chart, set BindingName property of the SunBurst chart. This property automatically organizes the flat data structure into logical groups without the need to use ChildItemsPath property, which is typically used for hierarchical data.
Variants of Sunburst
FlexChart also provides properties to create variations of sunburst chart representing both hierarchical and flat data as listed below:
Doughnut Sunburst Chart: Set the InnerRadius property to value greater than zero to create a hole in the center. By default, this property is set to zero.
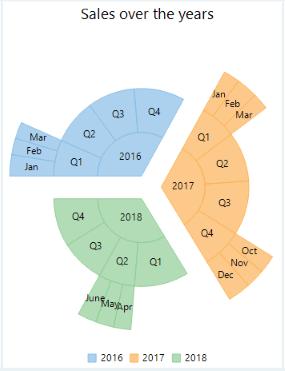
Exploded Sunburst Chart: Set the Offset property to value greater than zero to push the slices away from the center. By default, this property is set to zero.
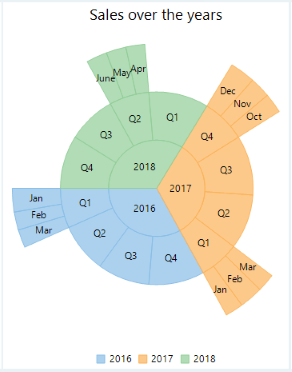
Reversed Sunburst Chart: Set the Reversed property to true that creates the chart with angles drawn in the counter clockwise direction. By default, this property is set to false.
Doughnut Sunburst Chart | Exploded Sunburst Chart | Reversed Sunburst Chart |
|---|---|---|
|
|
|
See Also
Getting Started with .NET Sunburst Chart for WPF, WinForms, and UWP


