Render Modes
The rendering mode in FlexChart determines how fast the control gets rendered at runtime. The FlexChart control supports two modes of data rendering, Default (GDI+) and DirectX.
In default rendering mode, the chart is rendered normally, but in high-performance DirectX rendering, millions of data points are rendered smoothly at a fast pace. To set the desired rendering mode, you can use the RenderMode property of the FlexChart class. This property accepts the values from RenderMode enumeration of the C1.Win.Chart namespace.
The table below lists the major differences between the Default and DirectX rendering.
| Rendering Types | Default Rendering | DirectX Rendering |
|---|---|---|
| Render Quality | Rendering of the charts is less smooth, clear and accurate. | Rendering of the charts is much smooth, clear and accurate. |
| Render Speed | Slow rendering with more lapse time. | Fast rendering with less lapse time. |
type=note
Note : Custom rendering using the Rendering/Rendered events applied through Graphics is not supported in DirectX rendering mode.
Configuring Rendering Capability in FlexChart Application
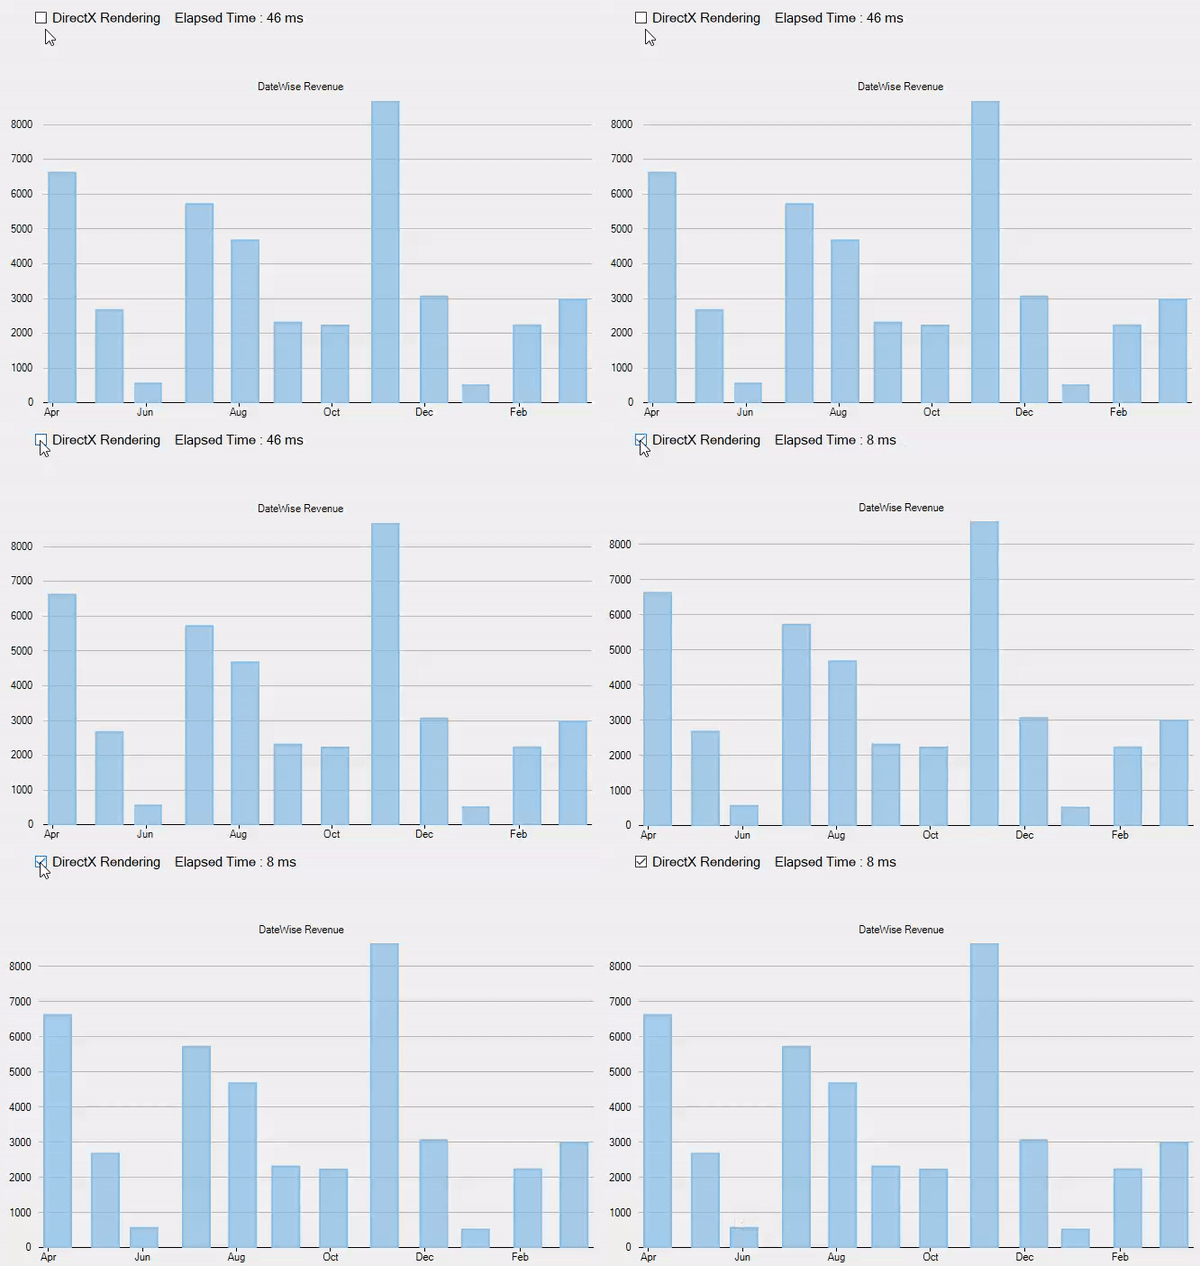
In this example, we will analyze the rendering quality of FlexChart in DirectX and Default rendering modes using CheckBox and StopWatch controls.

To configure rendering in a FlexChart application, follow the steps given below. This example uses the same code and data source from the Quick Start topic.
Add a CheckBox control named checkBox1 to the form. Handle the CheckedChanged event named CheckBox1_CheckedChanged. Use the RenderMode property of the FlexChart class within the event, so that the FlexChart control is in the default rendering mode in the unchecked checkbox state, and transits to the DirectX rendering mode in the checked checkbox state.
private void CheckBox1_CheckedChanged(object sender, EventArgs e)
  {
            flexChart.RenderMode = checkBox1.Checked ? RenderMode.DirectX : RenderMode.Default;
  }
Initialize the StopWatch control. The stop watch starts when chart starts rendering and stops when chart is rendered. For this purpose, you can call the Rendering event, which fires before the chart starts rendering, and call the Rendered event, which fires after the chart finishes rendering. Also, we use a label control to indicate the time elapsed by the StopWatch in milliseconds in both rendering modes.
_stopwatch = new Stopwatch();
this.flexChart.Rendering += (s, e) =>
{
    _stopwatch.Restart();
};
this.flexChart.Rendered += (s, e) =>
{
    _stopwatch.Stop();
    label1.Text = "Elapsed Time : " + _stopwatch.ElapsedMilliseconds + " ms";
};


