
Binding
Binding provides a way to create a link between FlexChart and the application data . FlexChart allows you to bind data coming from databases as well as data stored in other structures, such as arrays and collections. This topic discusses three ways to provide data to a chart.
Chart Binding
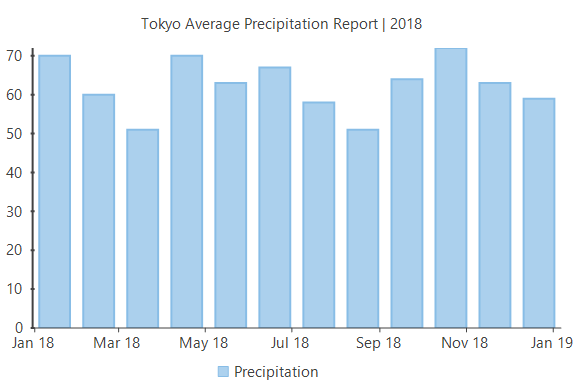
Chart binding is the simplest form of binding in which you just have to set a data source by setting the DataSource property and then map the Binding and BindingX properties to fields that you want to plot on Y-axis and X-axis of the chart respectively.
//Clearing default Series present in chart
this.flexChart1.Series.Clear();
//Passing data to FlexChart
this.flexChart1.DataSource = GetTemperatureData("Tokyo", 360).First().Data;
//Setting FlexChart's Header and styling it
this.flexChart1.Header.Content = "Tokyo Average Precipitation Report | 2018";
//Binding chart's AxisX to 'Date'
this.flexChart1.BindingX = "Date";
//Adding a Series to chart and binding it's (AxisY) to 'Temperature' field of Data
this.flexChart1.Series.Add(new Series
{
    //Name property specifies the string to be displayed corresponding to this Series in Legend
    Name = "Precipitation",
    Binding = "Precipitation"
});
'Clearing default Series present in chart
Me.flexChart1.Series.Clear()
'Passing data to FlexChart
Me.flexChart1.DataSource = GetTemperatureData("Tokyo", 360).First().Data
'Setting FlexChart's Header and styling it
Me.flexChart1.Header.Content = "Tokyo Average Precipitation Report | 2018"
'Binding chart's AxisX to 'Date'
Me.flexChart1.BindingX = "Date"
'Adding a Series to chart and binding it's (AxisY) to 'Temperature' field of Data
'Name property specifies the string to be displayed corresponding to this Series in Legend
Me.flexChart1.Series.Add(New Series() With {
.Name = "Precipitation",
.Binding = "Precipitation"
})Note that the above sample code uses a custom method namedGetTemperatureData tosupply data. You can set up the data source as per your requirements.
static Random rnd = new Random();
 // Method creating 'Temperature' data
 //Create data source for chart binding
public static List<CityDataItem> GetTemperatureData(string city, int count = 360)
{
    var data = new List<CityDataItem>();
    var startDate = new DateTime(2018, 1, 15);
    var dataItem = new CityDataItem() { Name = city };
    for (int i = 0; i < count;)
    {
        var temp = new Temperature();
        DateTime date = startDate.AddDays(i);
        temp.Date = date;
        temp.Precipitation = (date.Month > 6 && date.Day < 20) ? rnd.Next(45, 80) : rnd.Next(50, 75);
        dataItem.Data.Add(temp);
        i += 31;
    }
    data.Add(dataItem);
    return data;
}
Shared rnd As New Random()
'Method creating 'Temperature' data
'Create data source for chart binding
Public Shared Function GetTemperatureData(city As String, Optional count As Integer = 360) As List(Of CityDataItem)
Dim data As List(Of CityDataItem) = New List(Of CityDataItem)()
Dim startDate As DateTime = New DateTime(2018, 1, 15)
Dim dataItem As CityDataItem = New CityDataItem() With {
.Name = city
}
Dim i As Integer = 0
While i < count
Dim temp As Temperature = New Temperature()
Dim [date] As DateTime = startDate.AddDays(i)
temp.[Date] = [date]
temp.Precipitation = If(([date].Month > 6 AndAlso [date].Day < 20), rnd.[Next](45, 80), rnd.[Next](50, 75))
dataItem.Data.Add(temp)
i += 31
End While
data.Add(dataItem)
Return data
End FunctionAxis Binding
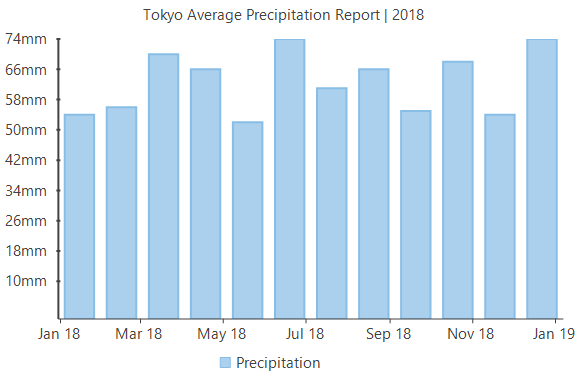
Axis binding refers to binding an axis with a separate data source to render axis labels different from what gets displayed on binding the chart with the chart data source. For instance, in the example above, we canoverride the Y-axis labels that are rendered automatically on binding with chart data source to display the precipitation values in mm. FlexChart providesDataSource andBinding properties so that you can bind your axes to another data source.
//Passing data to FlexChart's AxisY
this.flexChart1.AxisY.DataSource = GetAxisBindinglabels();
//Setting which fields to bind to AxisY
this.flexChart1.AxisY.Binding = "Value,Text";
'Passing data to FlexChart's AxisY
Me.flexChart1.AxisY.DataSource = GetAxisBindinglabels()
'Setting which fields to bind to AxisY
Me.flexChart1.AxisY.Binding = "Value,Text"Note that the above sample code uses a custom method namedGetAxisBindinglabels tosupply data. You can set up the data source as per your requirements.
//Create data source for axis binding
public static List<object> GetAxisBindinglabels()
{
    var data = new List<object>();
    for (double i = 10; i < 250; i += 8)
    {
        data.Add(new { Value = i, Text = i / 100 >= 10 ? string.Format("{0} mm", i / 1000) : string.Format("{0}mm", i) });
    }
    return data;
}
'Create data source for axis binding
Public Shared Function GetAxisBindinglabels() As List(Of Object)
Dim data As List(Of Object) = New List(Of Object)()
For i As Double = 10 To 249 Step 8
data.Add(New With {
.Value = i,
.Text = If(i / 100 >= 10, String.Format("{0} mm", i / 1000), String.Format("{0}mm", i))
})
Next
Return data
End FunctionSeries Binding
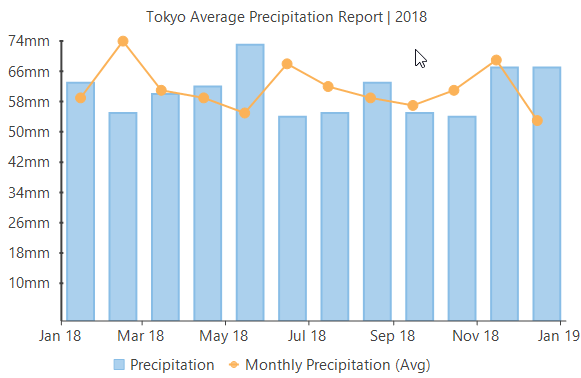
In series binding, you can bind a particular series to a separate data source and display the data which is not there in the originaldata source. For instance, in the example from above two sections, we can further add another series to show the average monthly precipitation in the same chartfrom a different data source.
//Create data for AxisX
var monthlyData = GetTemperatureData("Tokyo", 360).First().Data.GroupBy(x => x.Date.Month).SelectMany(grp => grp.Select(val => new
{
    Date = new DateTime(val.Date.Year, grp.Key, 15),
    Value = grp.Average(x => x.Precipitation),
})).Distinct().ToList();
this.flexChart1.Series.Add(new Series
{
    Name = "Monthly Precipitation (Avg)",
    Binding = "Value",
    ChartType = ChartType.LineSymbols,
    DataSource = monthlyData,
});
'Create data for AxisX
Dim monthlyData = GetTemperatureData("Tokyo", 360).First().Data.GroupBy(Function(x) x.[Date].Month).SelectMany(Function(grp) grp.[Select](Function(val) New With {
.[Date] = New DateTime(val.[Date].Year, grp.Key, 15),
.Value = grp.Average(Function(x) x.Precipitation)
})).Distinct().ToList()
Me.flexChart1.Series.Add(New Series() With {
.Name = "Monthly Precipitation (Avg)",
.Binding = "Value",
.ChartType = ChartType.LineSymbols,
.DataSource = monthlyData
})